5 Essential KPIs for Effective Demand Forecasting | thouSense
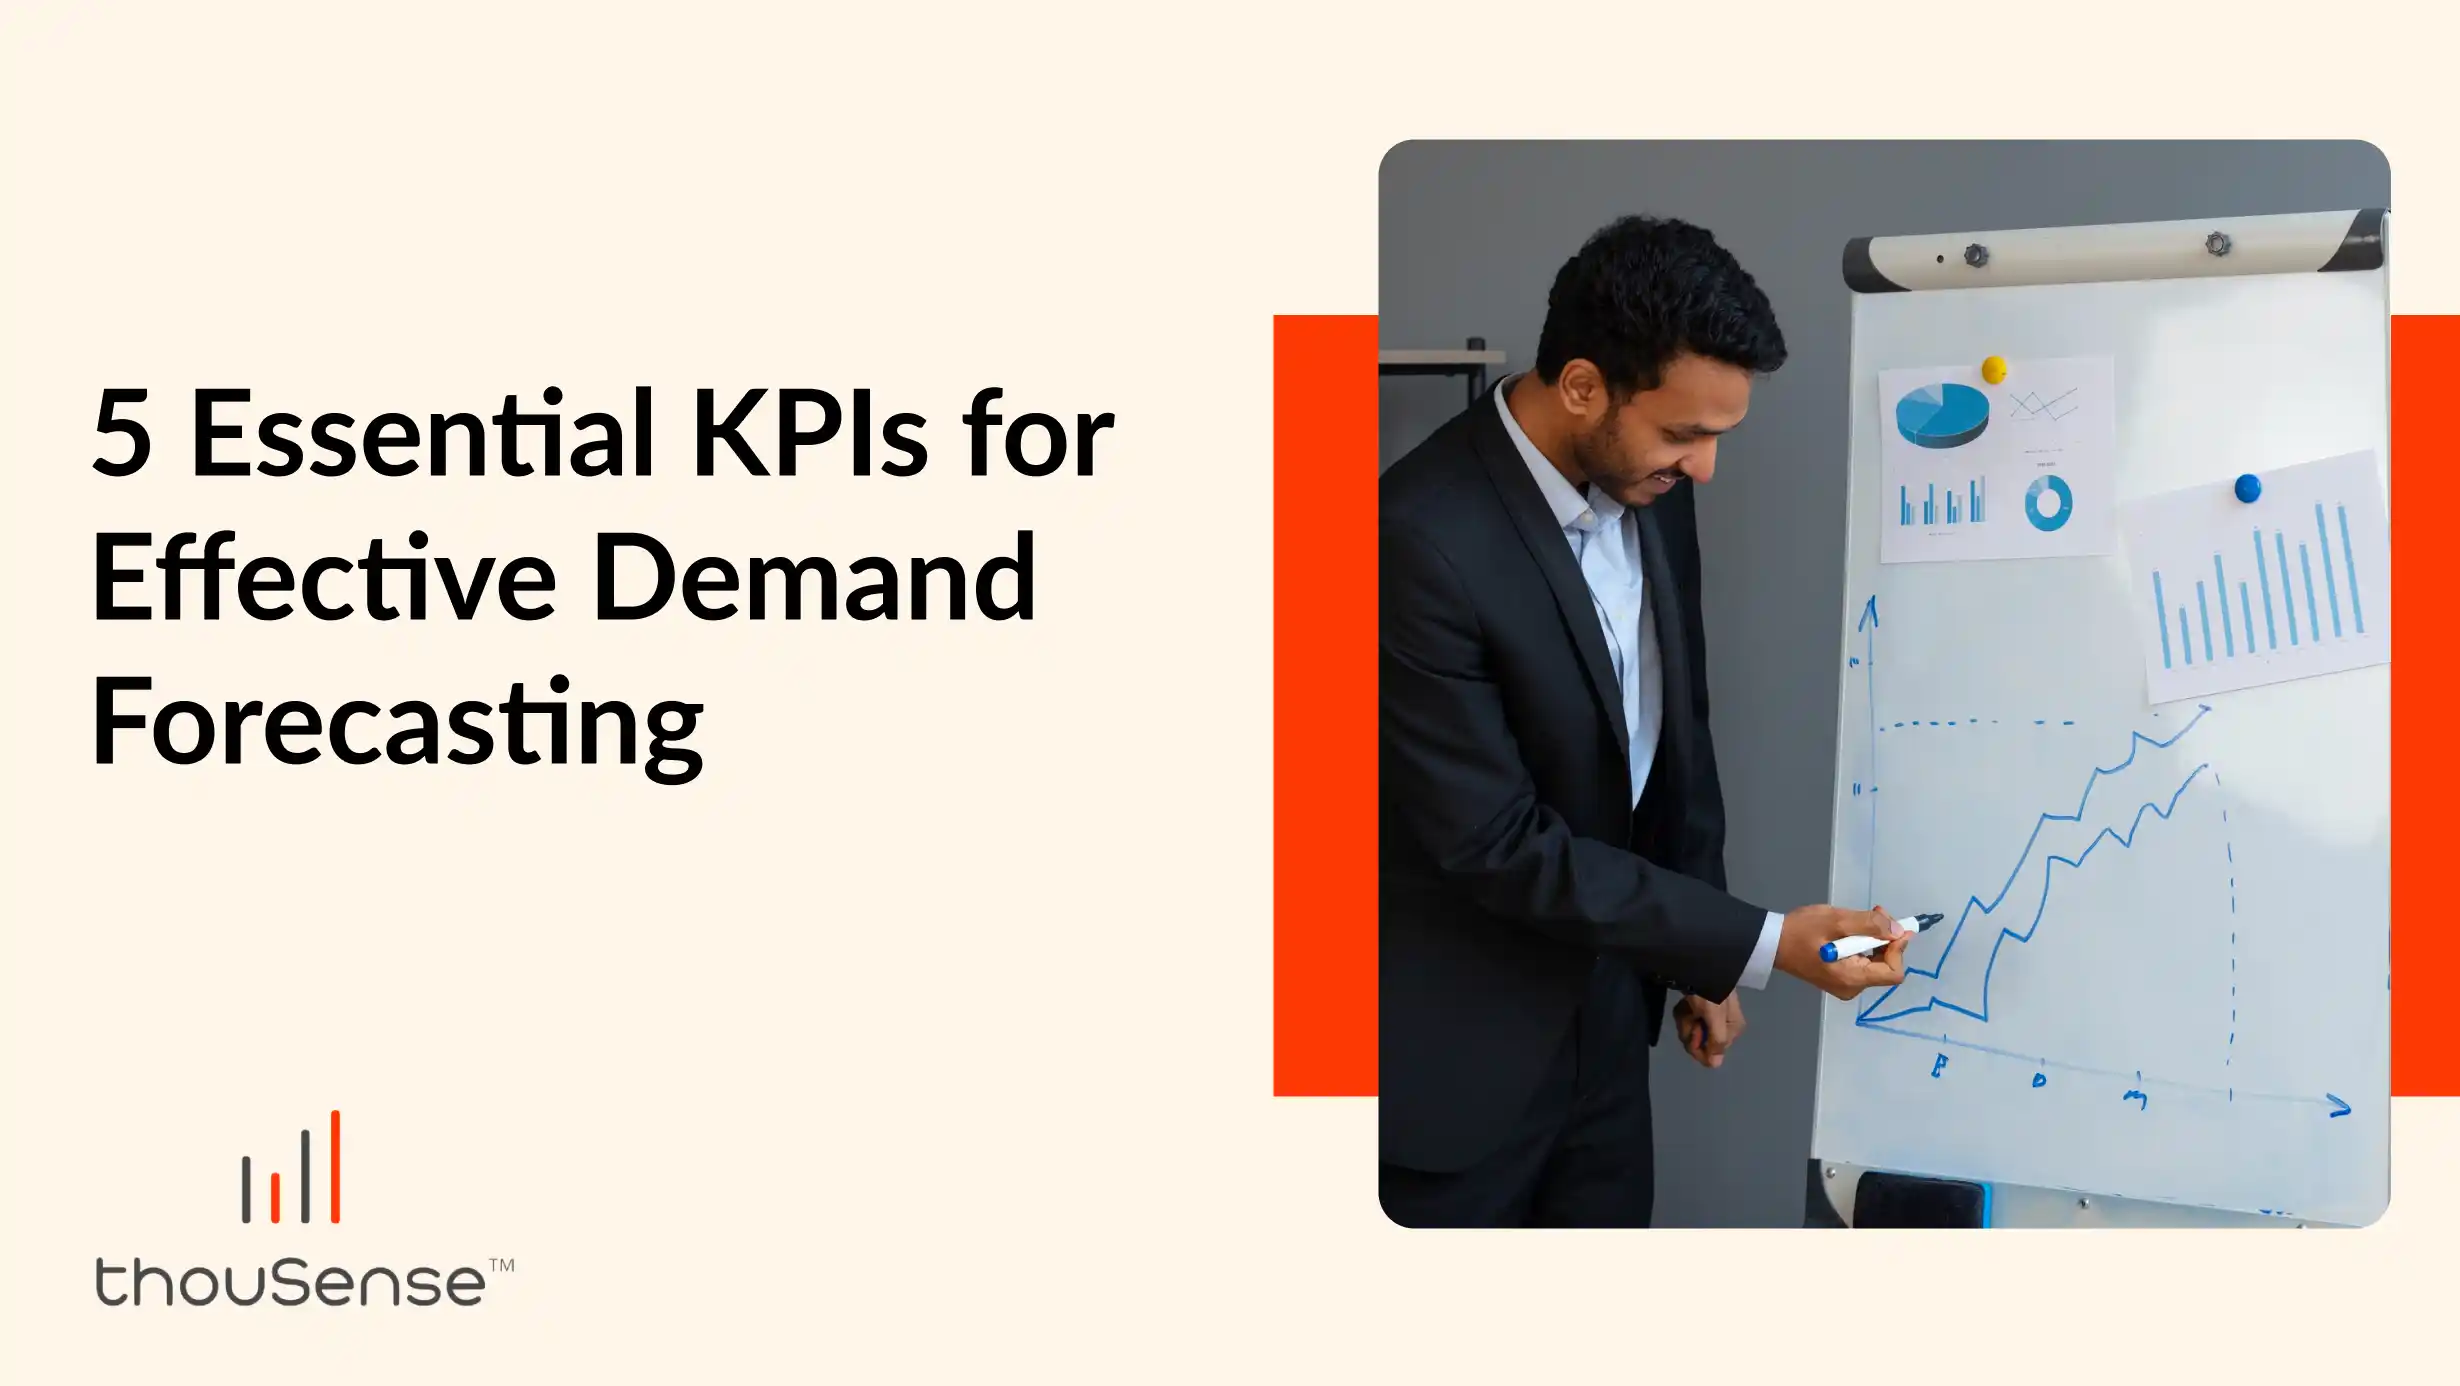
Forecasting demand helps businesses predict customer needs ahead of time. With demand forecasting, businesses can avoid situations like running out of stock or holding too many unsold products. However, forecasting alone is not enough—tracking performance using Key Performance Indicators (KPIs) makes sure predictions are useful.
In this blog, we will cover five essential KPIs for better demand forecasting, along with related concepts like what KPIs mean and why demand forecasting is necessary.
What is Demand Forecasting?
Demand forecasting means predicting how many products or services customers will need in the future. Forecasting gives businesses an idea of what customers will buy and when they will need it. Knowing this ahead of time helps them plan better. If businesses know future demand, they can avoid running out of products or holding excess stock. Both situations can lead to losses. Demand forecasts are based on data like past sales, seasonal trends, and customer behavior. Using tools like thouSense, businesses can improve forecasting accuracy by analyzing real-time trends. Retail stores, restaurants, and service providers all rely on demand forecasting to make sure they have enough supplies and can serve customers on time.
Why Do We Need Demand Forecasting?
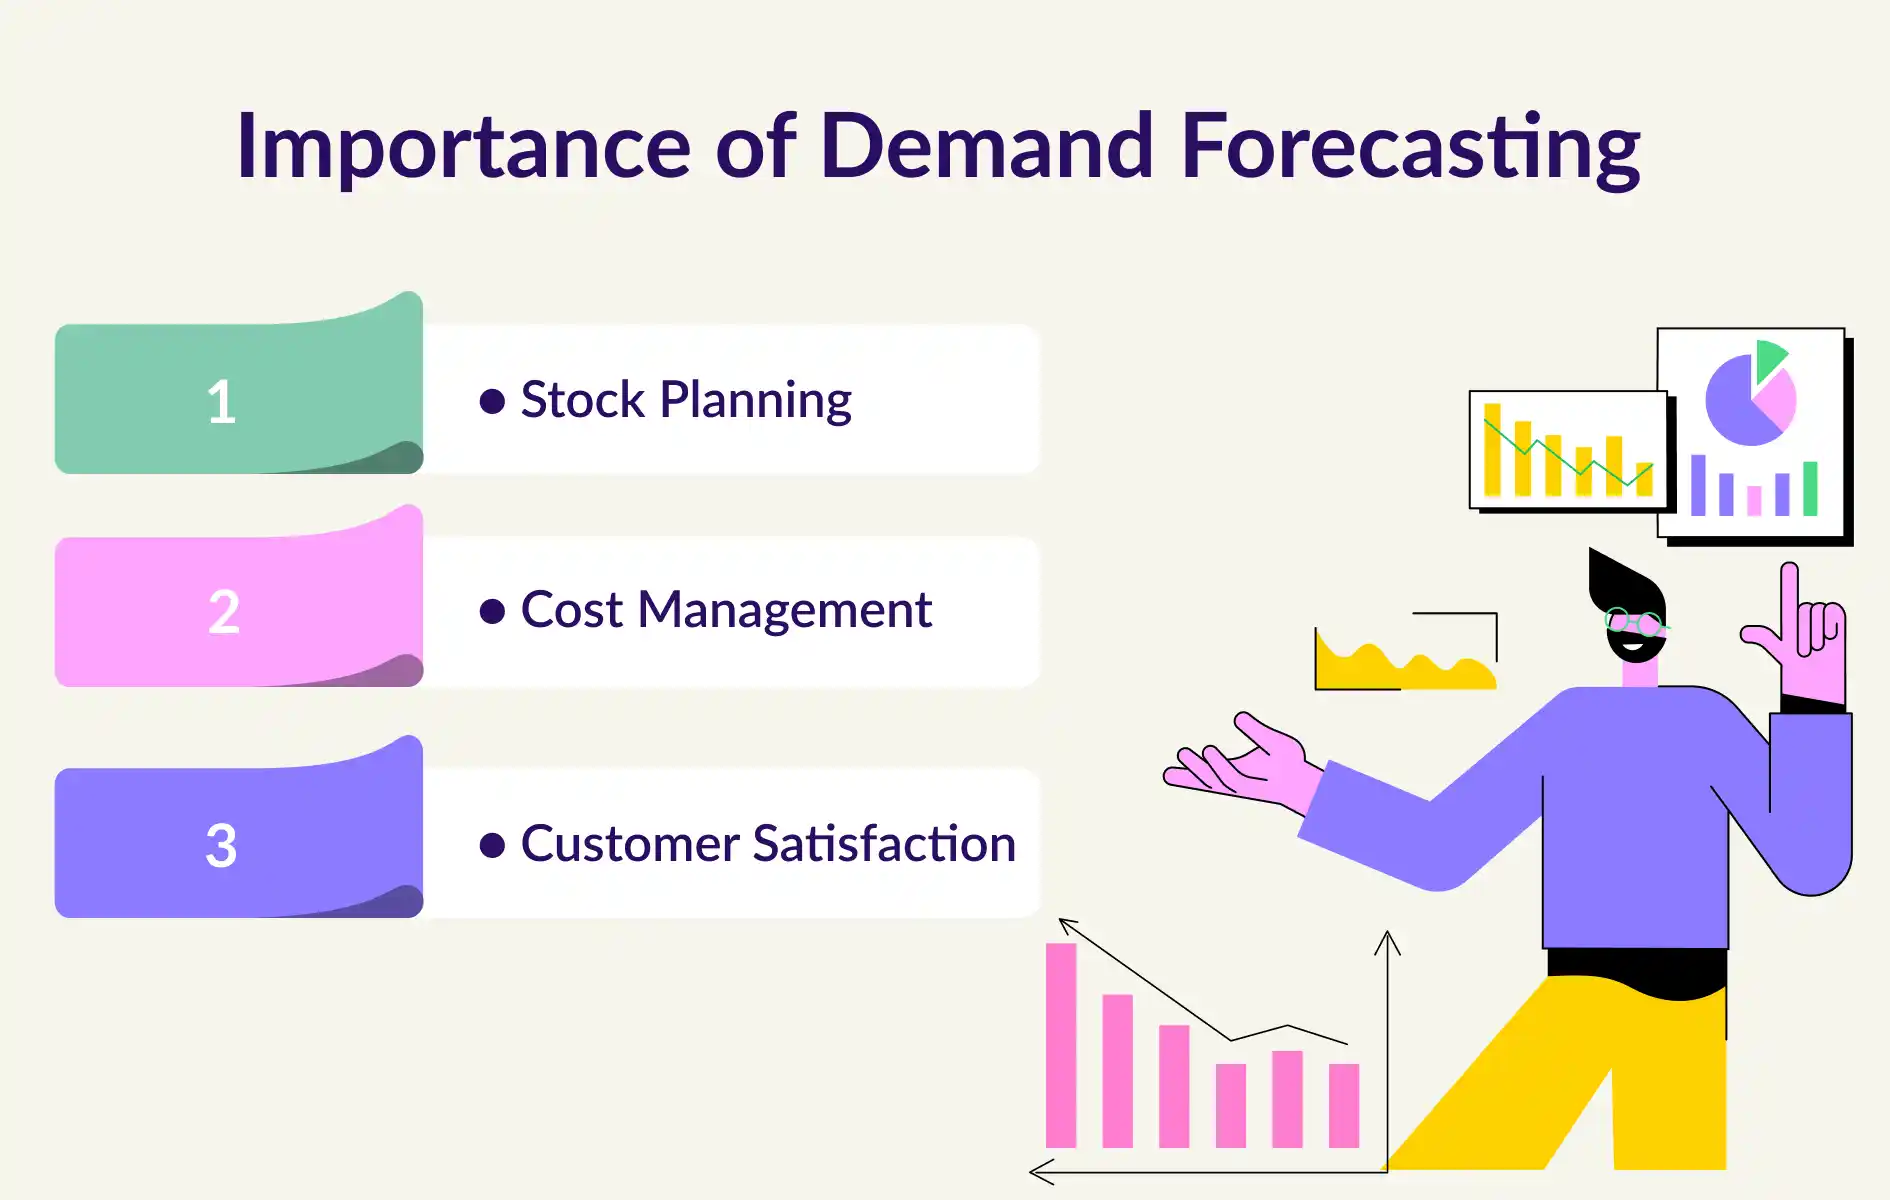
When businesses predict future demand well, they reduce risks like lost sales or wasted resources. Forecasting ensures they are prepared to meet customer needs.
● Stock Planning: Forecasting helps businesses stock just the right amount—enough to meet demand but not too much to avoid waste.
● Cost Management: Businesses spend money wisely when they plan according to demand, saving on unnecessary storage or emergency orders.
● Customer Satisfaction: If products are always available when customers need them, it builds trust and improves customer loyalty. Tools like thouSense provide businesses with better data to meet these goals.
What are KPIs?
KPIs, or Key Performance Indicators, are numbers that show if a business is meeting its goals. KPIs measure how well something is working. If the numbers look good, the business is on the right path. If not, they know it’s time to improve. KPIs help businesses understand whether they are meeting specific targets. For example, if a business wants to improve sales, it will track the number of products sold. Some KPIs check how fast orders are delivered, while others measure how often customers return. KPIs make it easy to measure performance and help businesses focus on what matters most.
How KPIs are Essential in Demand Forecasting
KPIs ensure that demand forecasting stays on track. They show what part of the forecasting process needs fixing. If forecasts are wrong, KPIs point out where the problem lies. This way, businesses can adjust and improve their predictions over time.
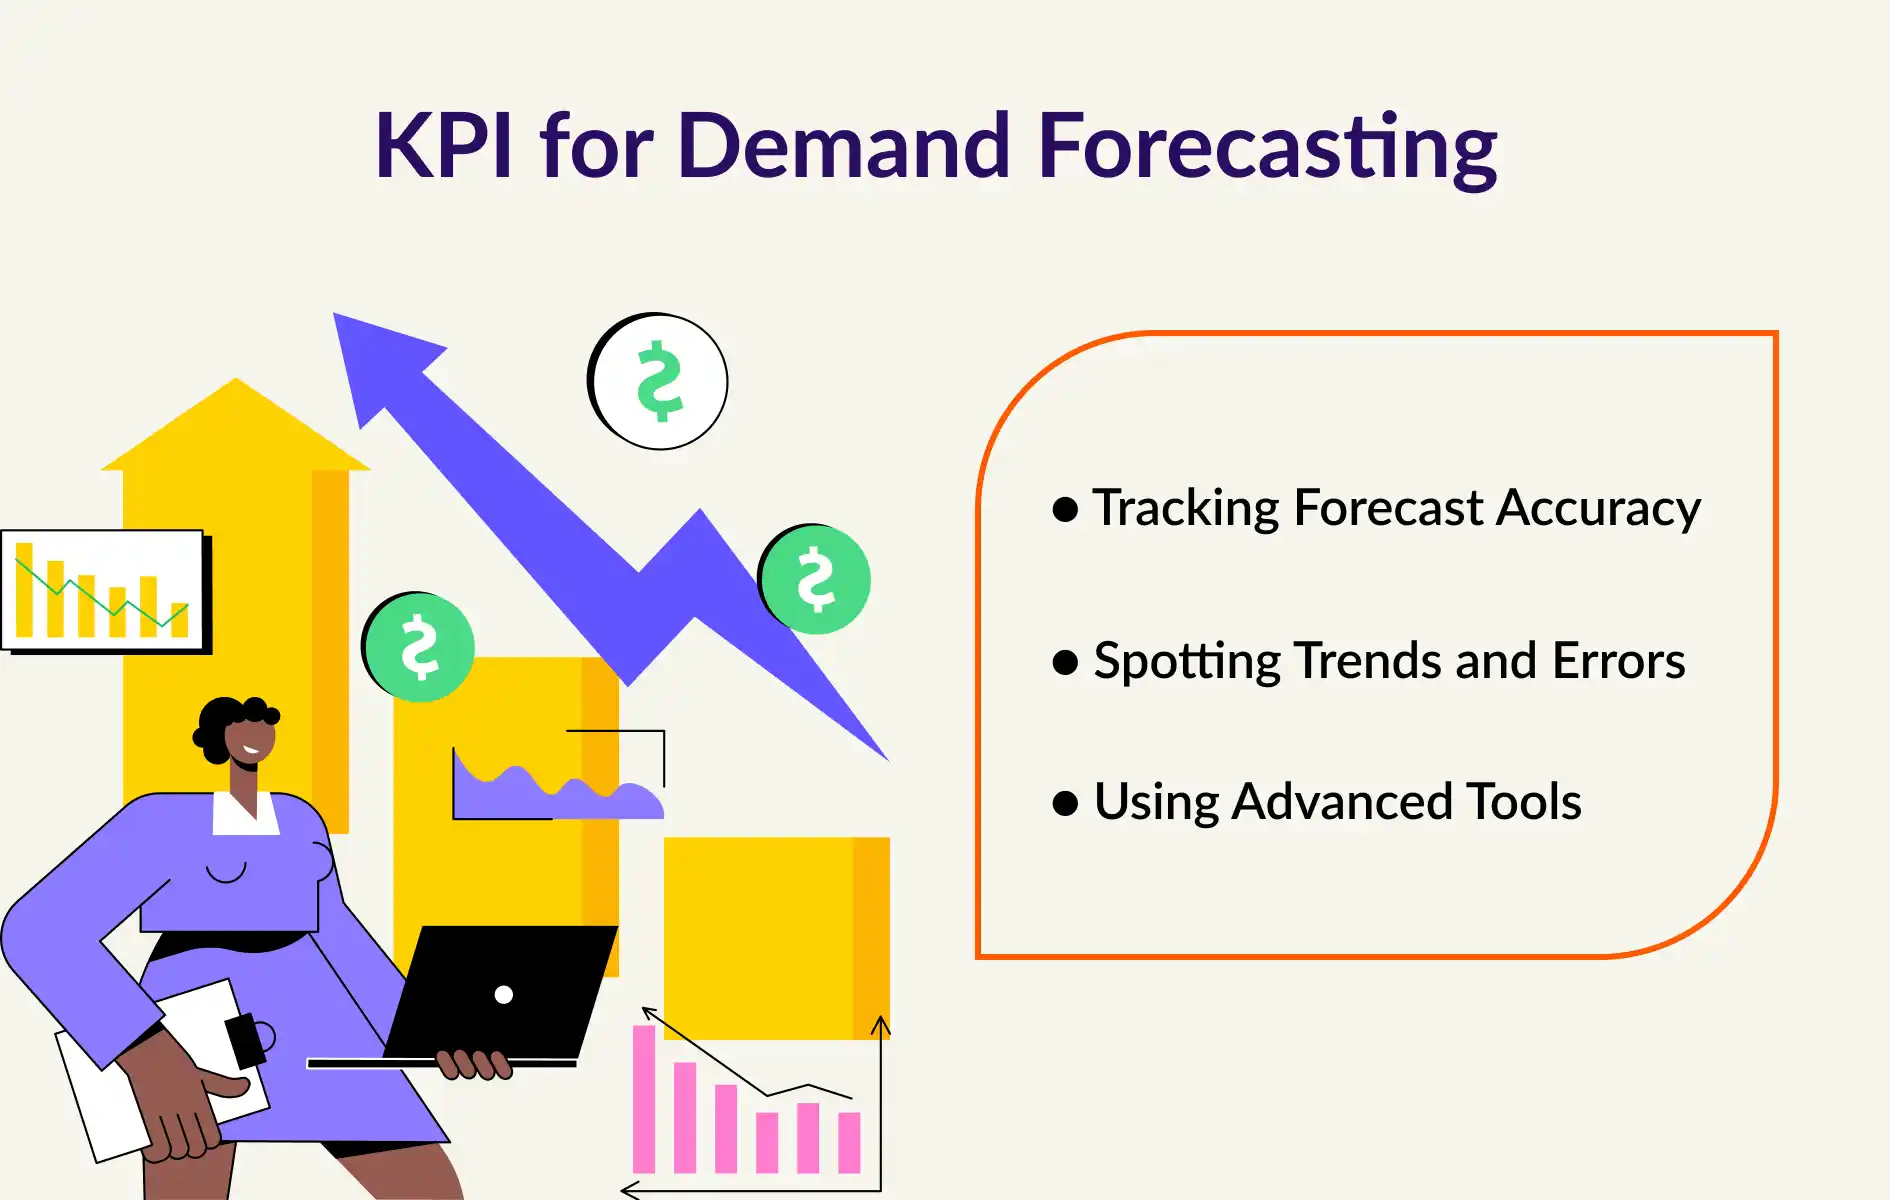
● Tracking Forecast Accuracy: KPIs such as accuracy tell businesses if their predictions are close to actual demand.
● Spotting Trends and Errors: Some KPIs show if forecasts are always too high or too low, helping businesses fix errors quickly.
● Using Advanced Tools: Modern tools like thouSense help businesses monitor KPIs and improve forecasting by using data insights.
Now, let’s understand the 5 essential KPIs for effective demand forecasting from the following points in detail.
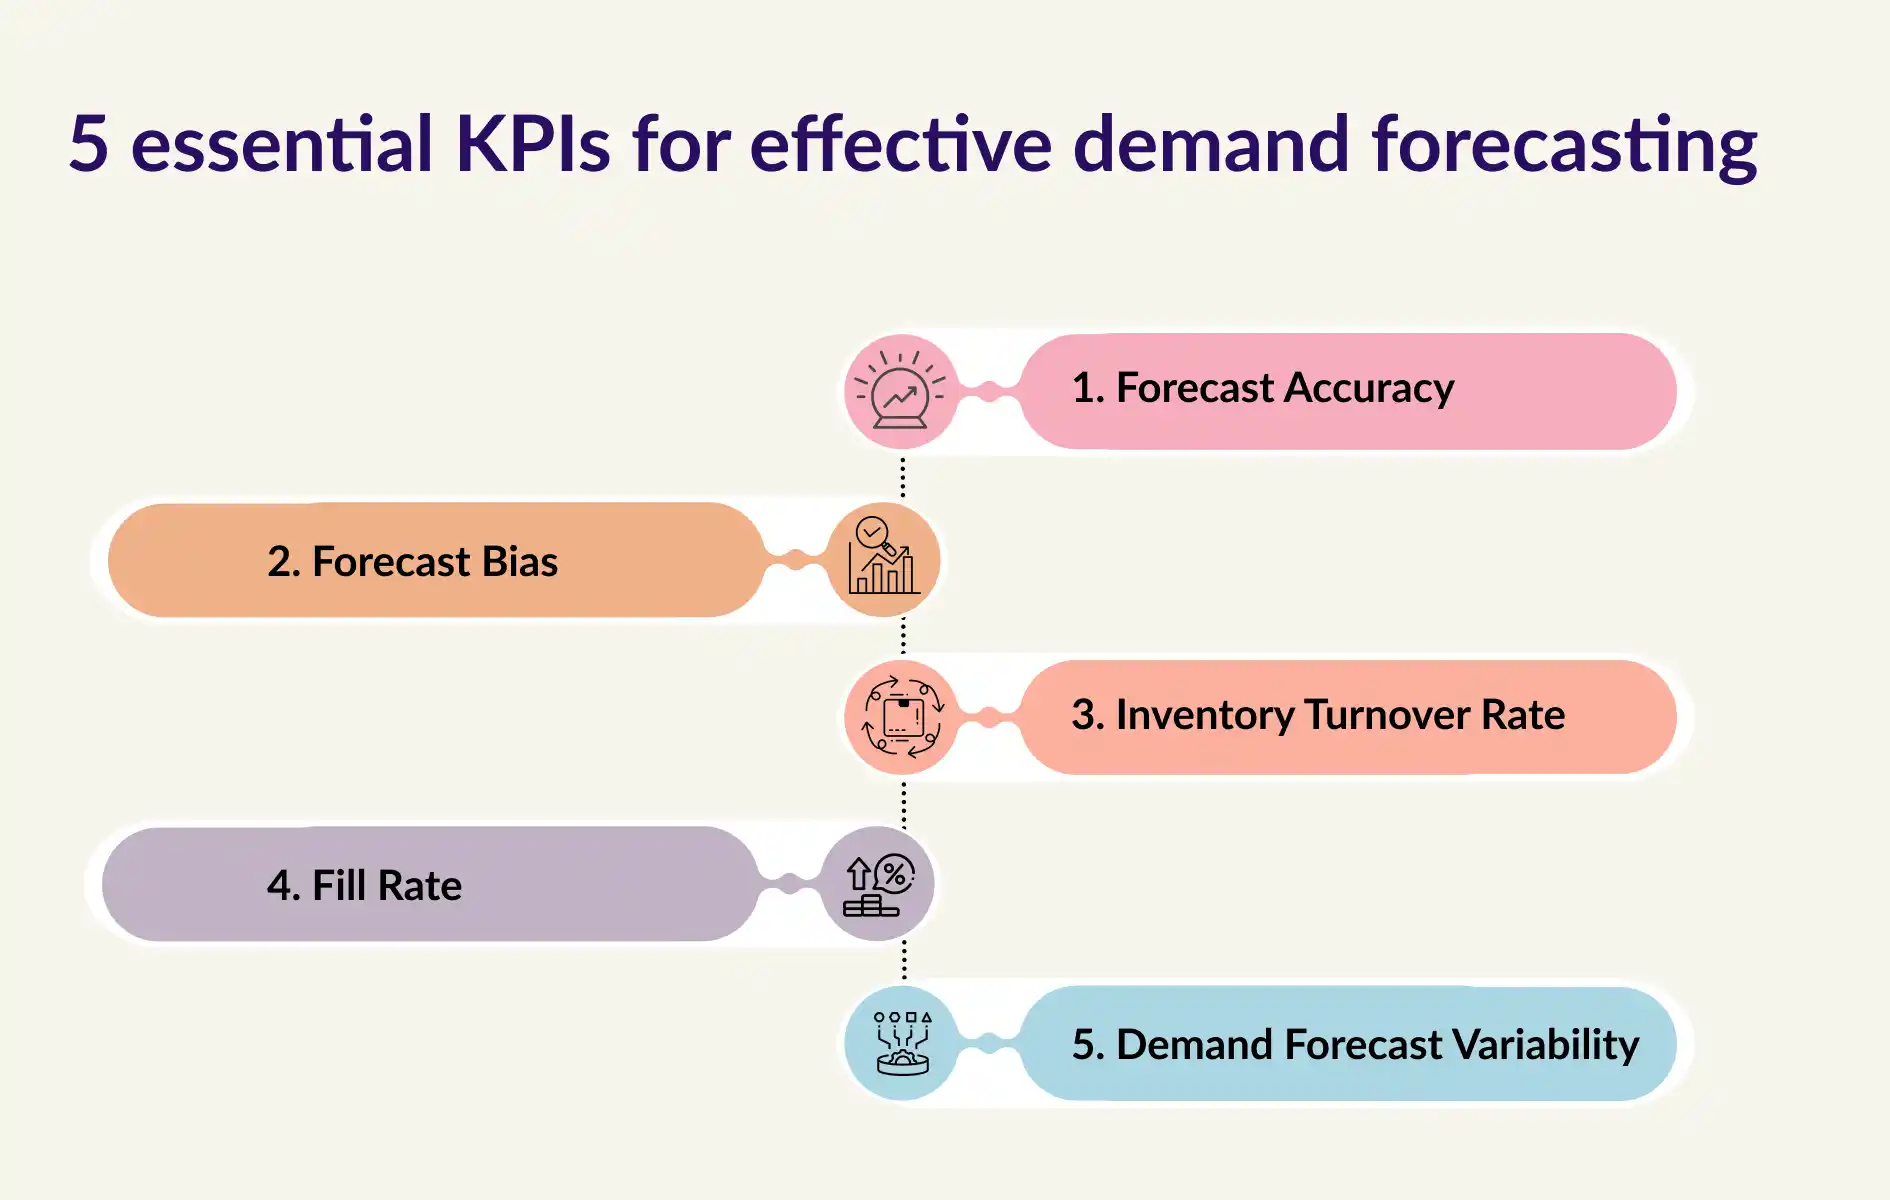
1. Forecast Accuracy
Forecast accuracy measures how close forecasts are to actual demand. It ensures predictions are reliable. Accurate forecasting helps businesses plan inventory and reduce waste. If predictions match actual sales, there are fewer risks of shortages or excess stock.
● Impact of Accuracy: When forecasts are accurate, businesses avoid wasting money on extra stock or losing sales due to stockouts.
● Tracking Forecast Accuracy: Businesses compare actual demand with predicted demand to calculate accuracy.
● How to Improve: With solutions like thouSense, businesses get real-time data that helps them make better forecasts.
2. Forecast Bias
Forecast bias happens when forecasts are always too high or too low. This KPI helps detect mistakes in forecasting patterns. Forecasts should be as close to actual demand as possible. Bias occurs when businesses consistently overestimate or underestimate demand.
● Types of Bias: Positive bias means predicting more demand than actual sales, leading to overstock. Negative bias means predicting less demand, resulting in stock shortages.
● Why It’s a Problem: Both overstocking and shortages affect customer satisfaction and increase costs.
● How to Fix Bias: Reviewing forecasts regularly and using tools like thouSense can help businesses reduce bias and improve predictions.
3. Inventory Turnover Rate
The inventory turnover rate measures how fast products are sold and replaced. It shows if businesses are managing stock efficiently. A high turnover rate means products are selling quickly, while a low rate means items are staying on shelves too long.
● How It Helps: Businesses with a good turnover rate avoid holding old stock that might expire or go out of fashion.
● Link to Demand Forecasting: Forecasting helps maintain the right inventory levels, ensuring products don’t sit in storage for too long.
● How to Optimize: thouSense offers tools that help predict demand better, improving inventory turnover rates.
4. Fill Rate
Fill rate measures how well businesses can fulfill customer orders from available stock. It ensures that customers get what they order without delays. A high fill rate means the business meets customer needs on time. A low fill rate suggests that products are often out of stock.
● Why It Matters: If customers cannot get what they want when they need it, they may go elsewhere.
● How Forecasting Helps: With accurate demand forecasting, businesses can stock the right amount of products, ensuring orders are fulfilled promptly.
● Improving Fill Rate: Solutions like thouSense provide real-time data to help businesses plan better and maintain high fill rates.
5. Demand Forecast Variability
Demand forecast variability measures how much forecasts change over time. It reflects how consistent predictions are across different periods. Consistent forecasts help businesses plan better. If predictions keep shifting, it creates confusion and makes planning difficult.
● Why Consistency Matters: If forecasts change too often, businesses might face delays or shortages because of sudden shifts in stock planning.
● What Causes Variability: Seasonal changes, holidays, or unexpected trends can make demand harder to predict.
● How to Handle Variability: Monitoring variability with tools like thouSense helps businesses adjust forecasts and stay prepared for changes.
Conclusion
Using the right KPIs makes demand forecasting more effective. Forecast accuracy, bias, inventory turnover, fill rate, and variability are essential KPIs for tracking forecast performance. When forecasts are reliable, businesses can avoid losses, improve stock management, and keep customers happy. Tools like thouSense provide valuable insights, helping businesses make smarter forecasts and improve decision-making. By monitoring these KPIs, businesses can plan better, meet demand consistently, and grow with confidence.
FAQs
1. Why are KPIs important for demand forecasting?
KPIs measure how well forecasts align with actual outcomes. They show if the forecasting process is working and where improvements are needed.
2. How often should KPIs for demand forecasting be reviewed?
KPIs should be reviewed regularly weekly or monthly. This helps businesses catch errors early and make timely adjustments.
3. How does demand forecasting improve business performance?
Accurate demand forecasting ensures products are available when customers need them, reducing waste and improving profits. It helps businesses meet customer needs and grow efficiently.
4. What Are Demand Planning KPIs?
Demand planning KPIs track how well demand is planned, using metrics like accuracy, bias, inventory turnover, and service level.
5. What are the key KPI for demand forecasting?
Key demand forecasting KPIs include accuracy, error margins (MAD, MAPE), and demand changes over time.