Getting Started with thouSense
Free Trial - How to Sign Up
- To sign up for thouSense, head to https://lite.thousense.ai and click the "Get 30-Day Free Trial" button.
- Fill out the registration form and click on Register.
- You will get a magic link via email from noreply@thoucentric.com to verify your email address and login
- Click on the magic link in the email to log in
- You are now a verified user and can continue to upload your data and generate forecasts
The Dashboard
Once you complete the signup process, you will be redirected to the dashboard.
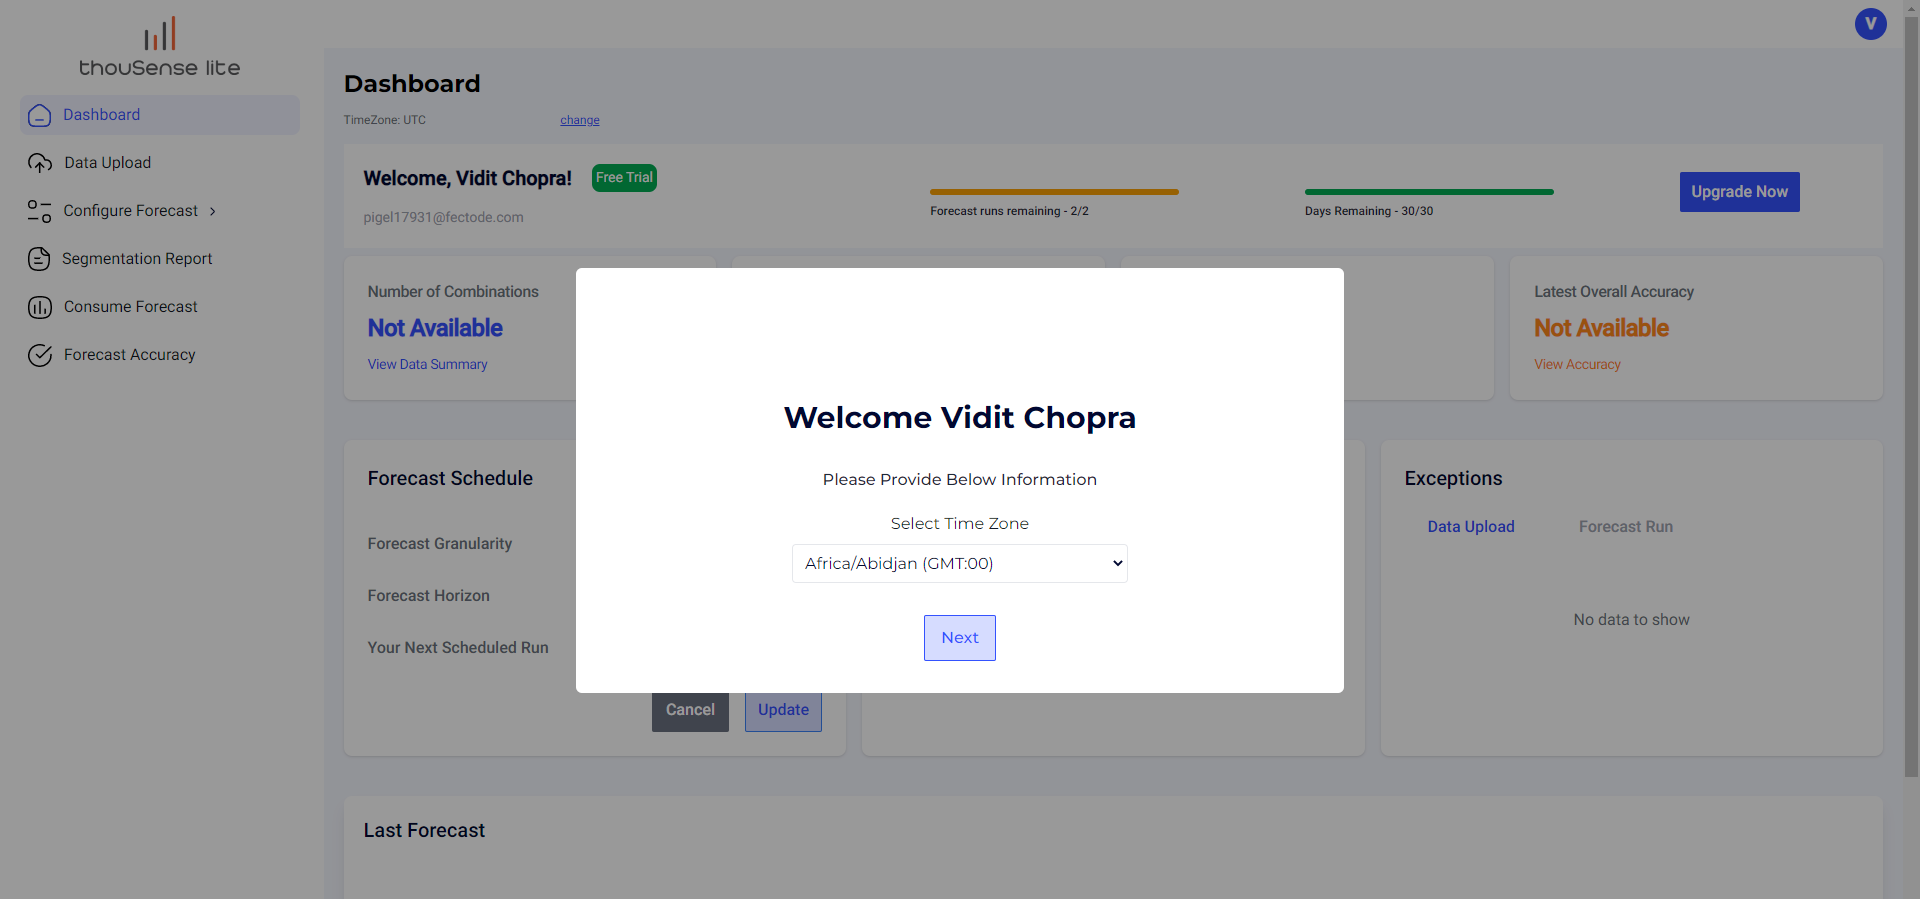
Time Zone and Date Settings
On the first login, you will be asked to set your time zone and date settings via a modal. The Time Zone that you select will configure all the timestamp across the dashboard to that time zone.
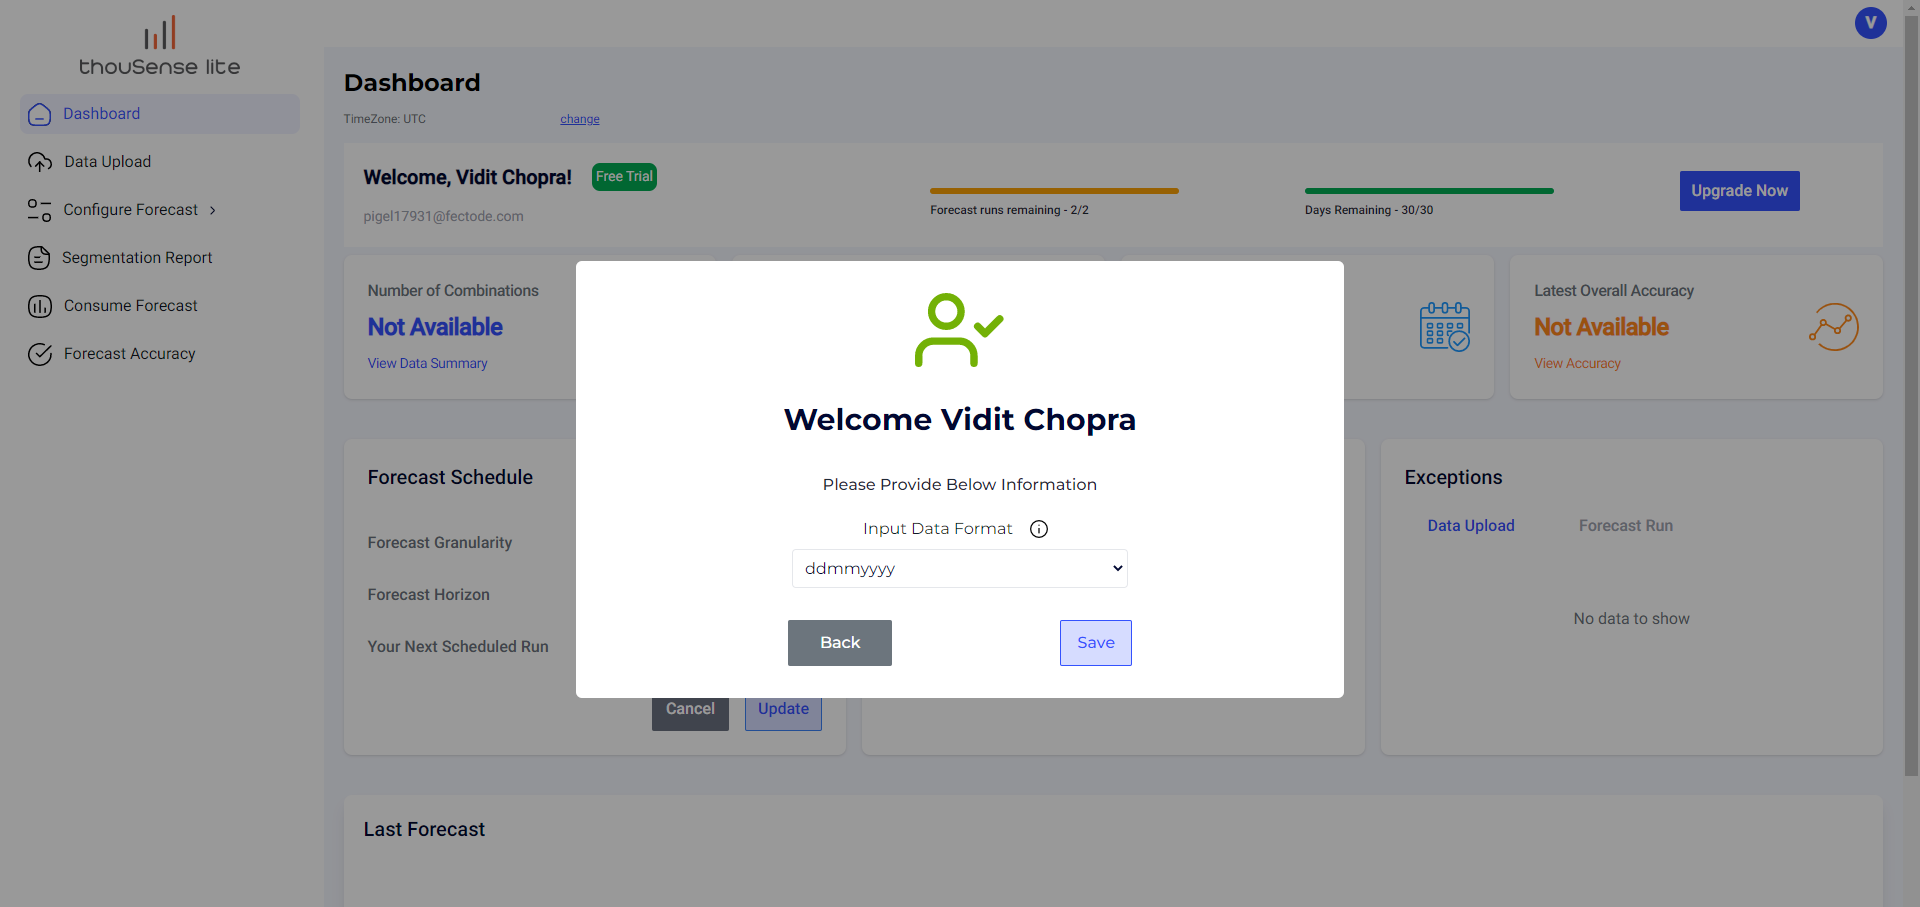
Date Format
After setting your time zone, you will be asked to configure the date format setting for your input data. The Date Formats currently supported by thouSense include DD-MM-YYYY and MM-DD-YYYY.
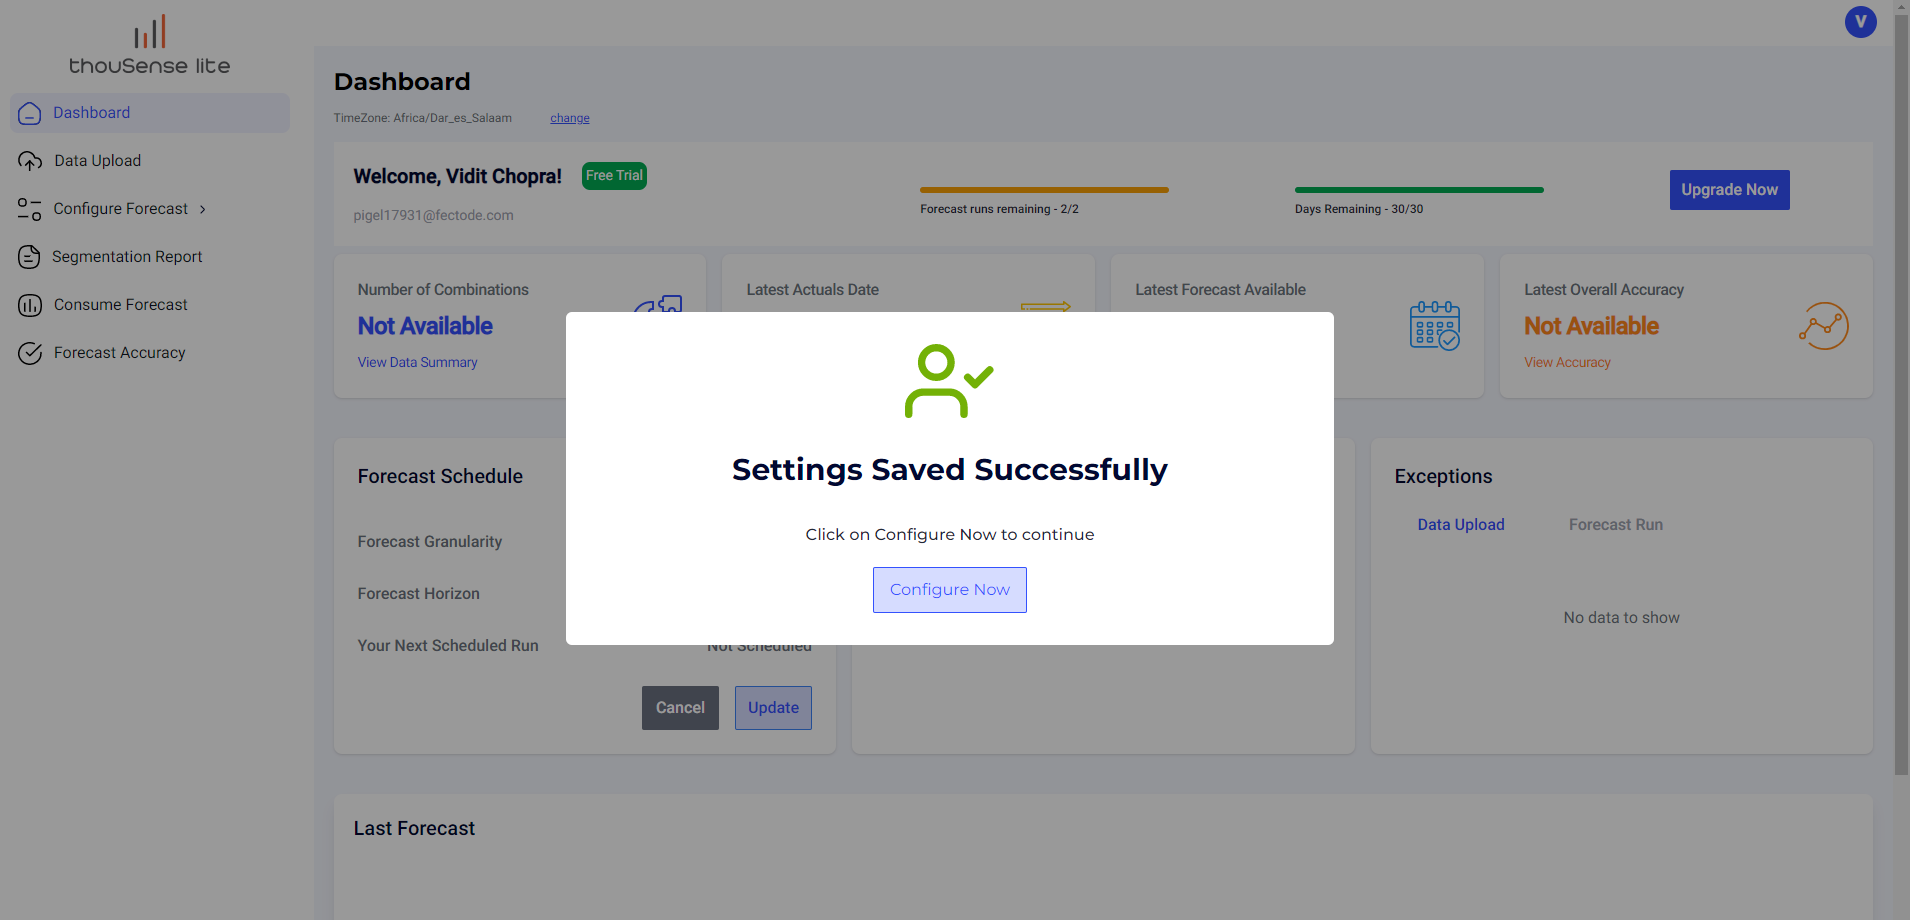
After confirming the time zone and date format you will get a confirmation screen, about your settings getting saved.
Data Upload
To upload data relating to your demand, the user can go to the 'Data Upload' tab from the menu.
Once the global setting information has been set by the user, the user is allowed to continue to upload their datasets for generating their demand.
The user is allowed to upload four kinds of data sets(based on subscription type). As a trial user, the user has access to the following files:
1. Hierarchy Data
2. Demand Data(Mandatory)
Hierarchy Data
File Format Supported – CSV
Example File Format:
Demand Data
File Format Supported – CSV
Example File Format :
- All the columns before the date column are considered as hierarchy columns and are available as a filter when you look at the reports.
- It is mandatory to have the date as the 2nd last column of the file while the last column is expected to be quantity.
FAQs about Demand Data
Duplicate Rows – The thouSense Lite system only allows for one row per combination for a unique date. In case two rows are available in the uploaded file that contains the same information of item code-warehouse-date but have different quantities, only the last row will be considered and the remaining rows for this combination above the last row will be dropped. Please aggregate the data for all combinations at a daily level before uploading to avoid data quality issues.
Date Format – For both the first and incremental demand data uploads, please make sure to upload the data in the same date format as defined in the global settings. If the data is uploaded in a different date format, it may cause the upload to fail/cause data inconsistency.
Quantity Column - The quantity column should not have any commas between the numbers. For example, if the quantity for Product A at Location B is 66000, if the quantity mentioned is 66,000 (with a comma), the row will be dropped. This has been added to maintain the sanctity of the number format
Headers – For incremental uploads, the headers need to be consistent i.e. the header names and the number of columns should always be the same as done during the first upload. In case additional columns are added or existing ones are removed in a new upload, the upload will fail.
Upload Summary
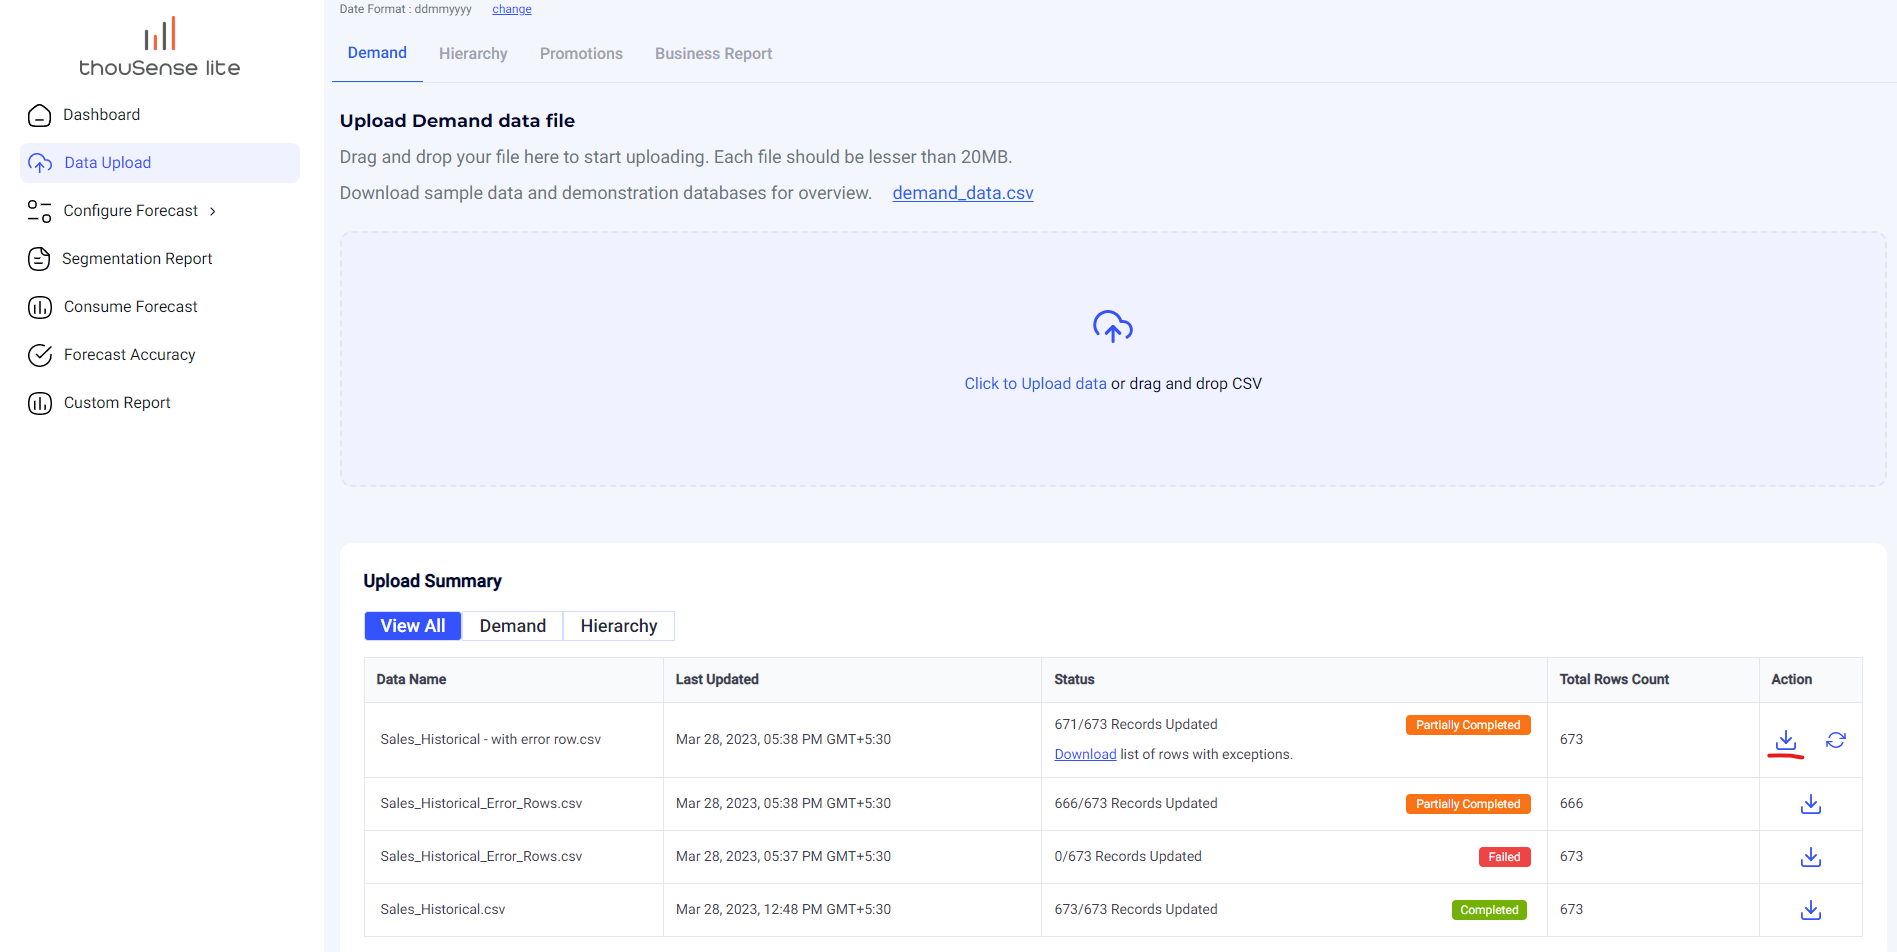
Once the user has uploaded the data and clicked on ‘Import’, the user will be able to see a new row added in the 'Upload Summary’ section of the page at the bottom. The upload summary section contains information on all the uploads that the user has made in the past along with the status of those uploads.
Every time a user uploads a file, they see a timestamp log along with the data ingested into the system at an individual file level. In case there are any errors identified in any of the rows during the upload, the status will show ‘Partially Completed’ if a few rows have been omitted due to errors or ‘Failed’ if all rows have issues / the file schema has changed.
The errors related to the failure and partial completion can be seen by clicking on the yellow (partially completed) or red (failed) box in the Status column. This will redirect the user to the dashboard where the identified exception and reasons for failure/dropping of rows is listed.
Download Rows with Exceptions – Partially Completed Upload
In the case when a file uploaded by the user is only partially completed, the user will get an option to ‘Download’ a list of rows with exceptions.
Once the user clicks on the ‘Download’ button, a CSV file will be downloaded that will contain the list of rows, along with the row number where the issue was identified and the exception that was raised corresponding to that specific row.
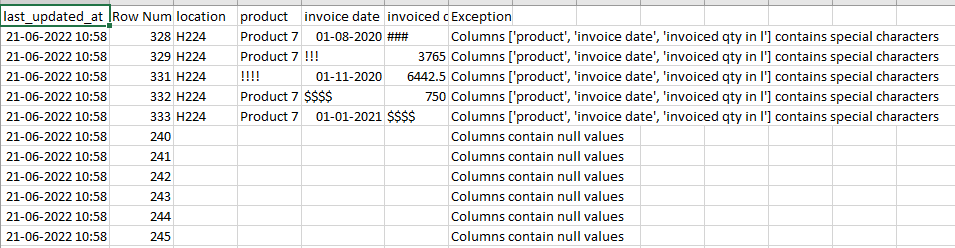
The user can verify, resolve these issues and re-upload the data with the required changes to resolve the exceptions.
*NOTE* - The list of exception rows is only available for the most recent demand data upload. After a new file is uploaded, the list of exceptions for the previous uploads is no longer available to the user.
Actions – Download Individual Data Upload
The user can download individual files that they have uploaded to thouSense Lite by clicking on the ‘Download’ icon under the actions column on the upload summary page. This will download the file that has been uploaded by the user in the raw format i.e. as it was uploaded onto the system without any exceptions that the system may have raised.

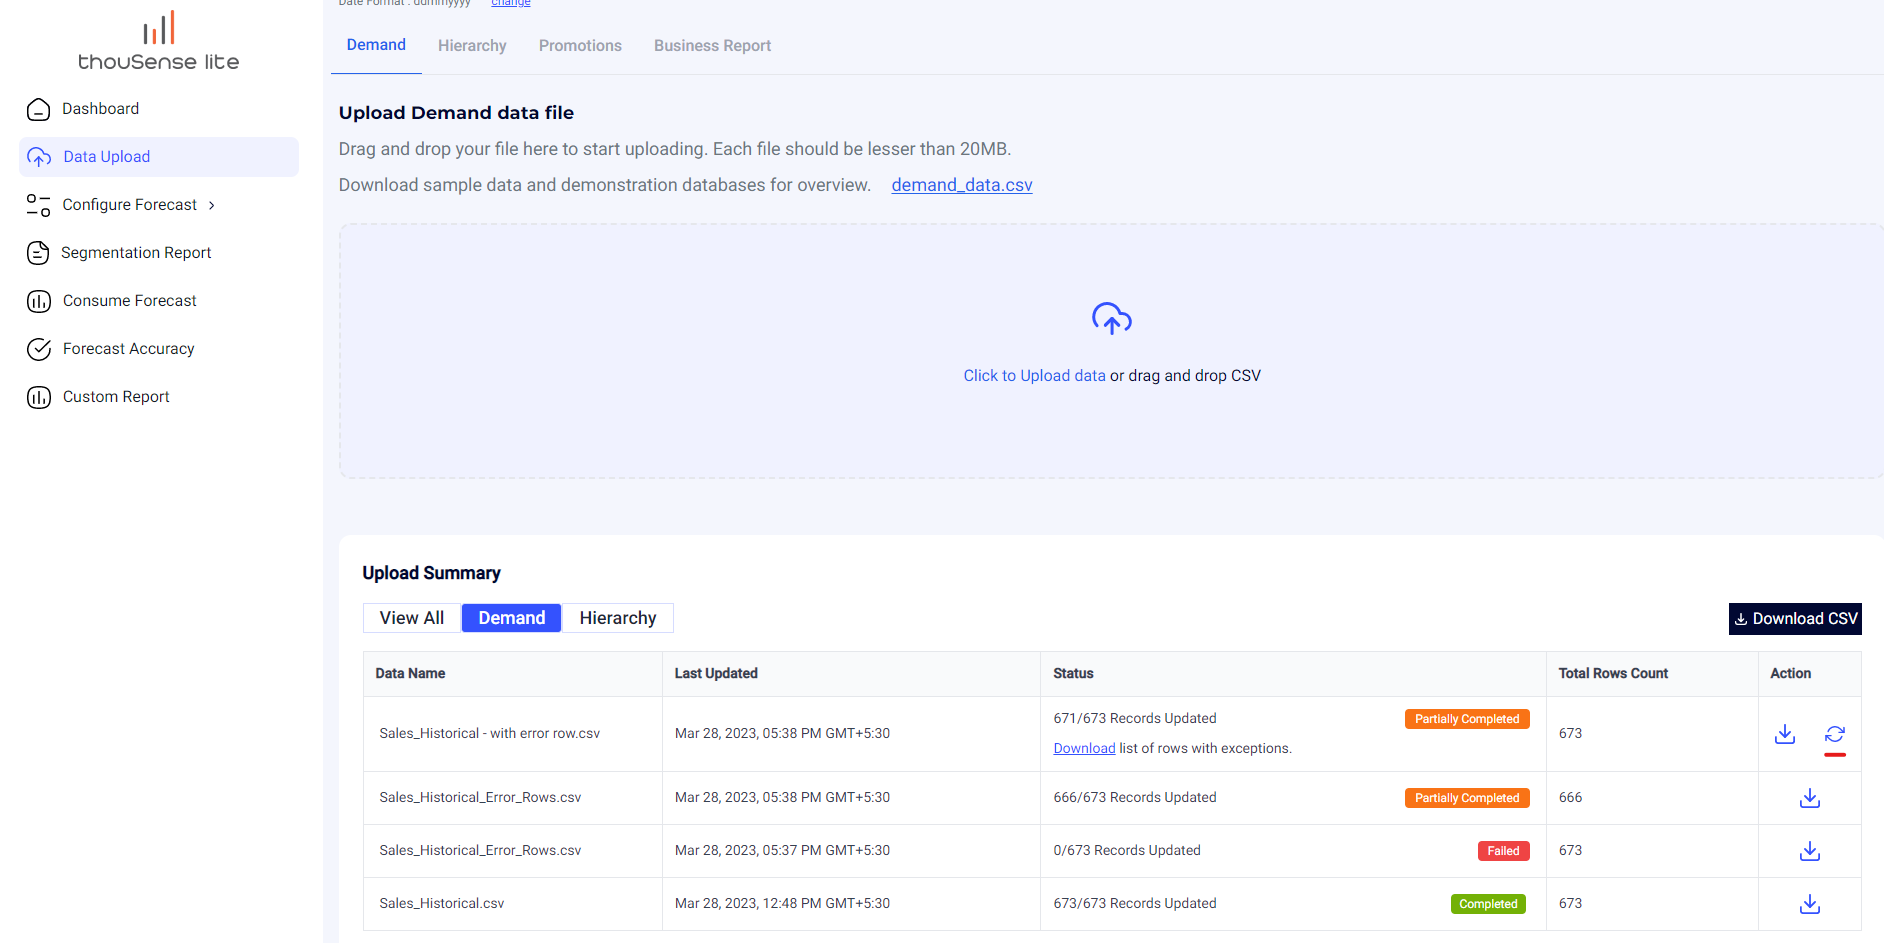
Actions – Download Complete Demand Data
The ‘Download Complete Demand Data’ button on the top right of the upload summary screen downloads the entire data set that the system has stored in the database. This is the data that thouSense Lite utilizes for the purpose of modeling and forecasting.
The user can click on this button to get a complete download of the demand data as it is stored in the database. This will download the data spanning all your uploads
Actions – Rollback Demand Data
The rollback of demand data button allows the user to roll back their demand from the current upload to one previous upload.
Once the user clicks on the rollback button under the actions column, the user will be asked to confirm that they want to roll back to the previous upload. Upon confirmation, the most recent file will be removed from the history and the data will be reset to the version before the latest upload.
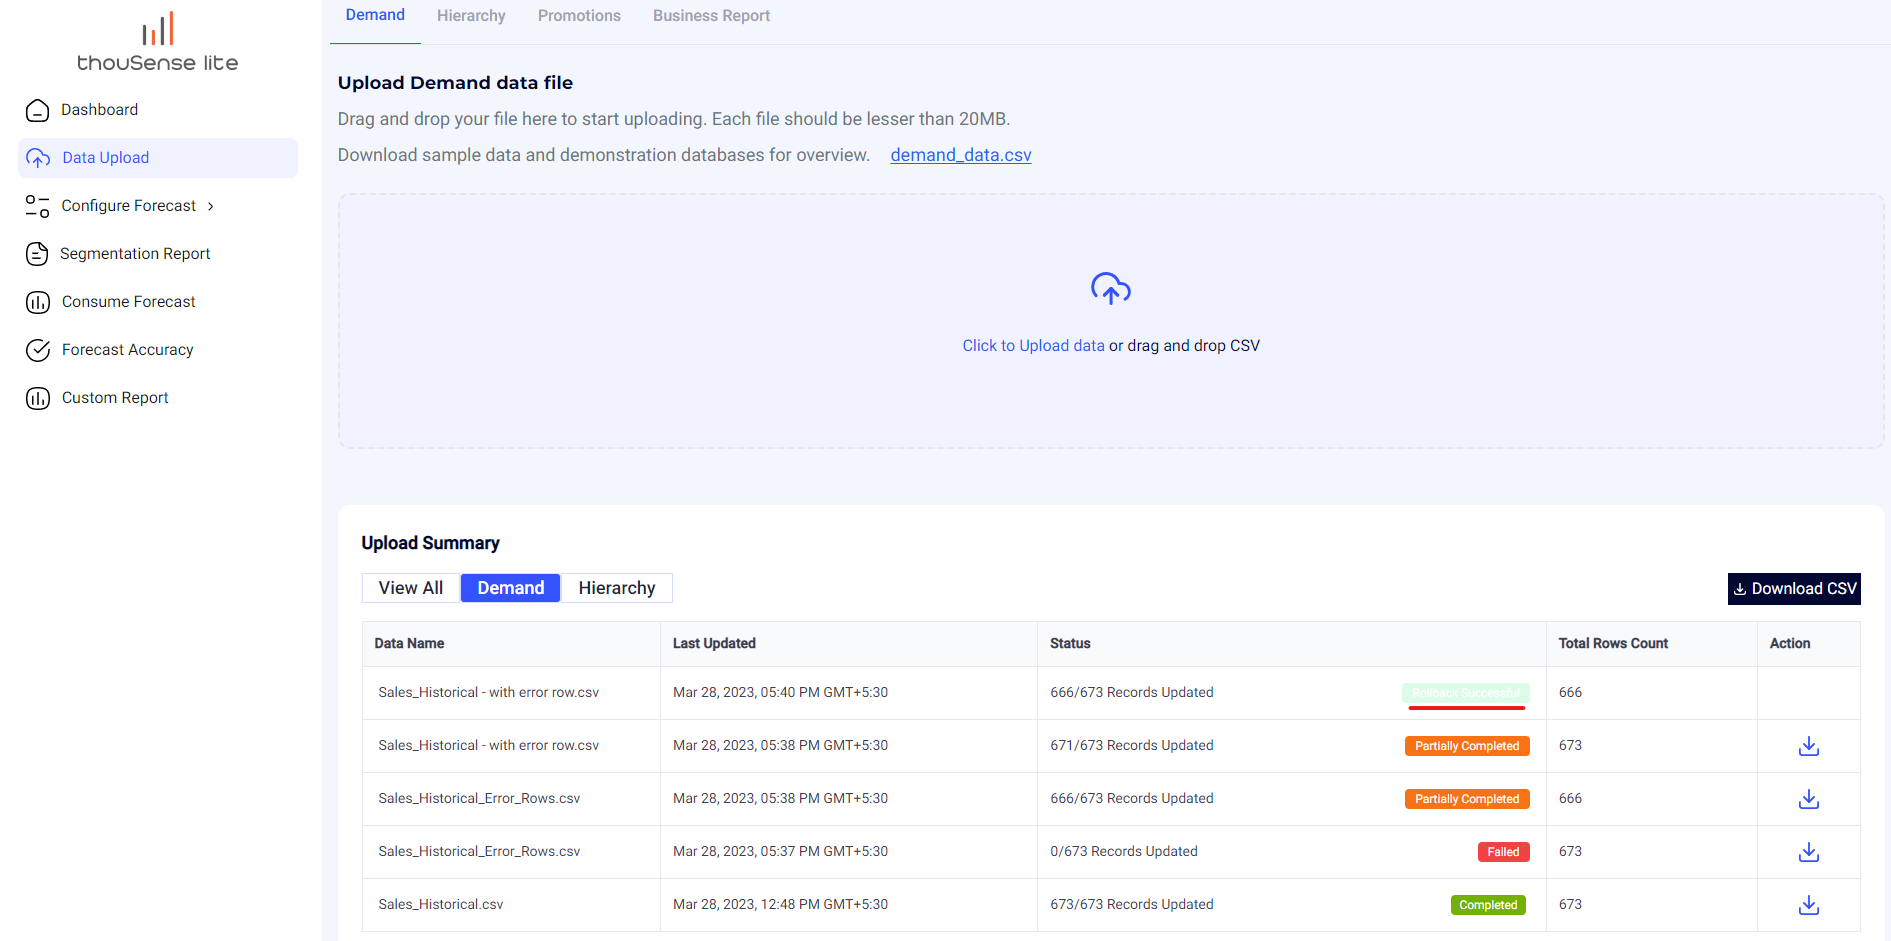
Note - Rollback is only allowed for the latest upload. The user will be able to utilize this functionality only once for each upload.
Configure Forecast
Once the user has verified that the uploaded dataset is correct and is validated, the user can click on the 'Configure Forecast' tab from the menu. This takes the user to the configure forecast page
Forecast Parameters
The first sub-tab of configure forecast is the Forecast Parameters screen that allows the user to configure the following parameters:
Forecast Granularity
- The level at which the user wants to forecast
- Currently, thouSense Lite supports weekly and monthly forecast granularity
Forecast Horizon
- The timeframe for which the user wants to forecast
- The period can range from 1 month to 24 months on a monthly granularity and from 1 week to 104 weeks on a weekly granularity
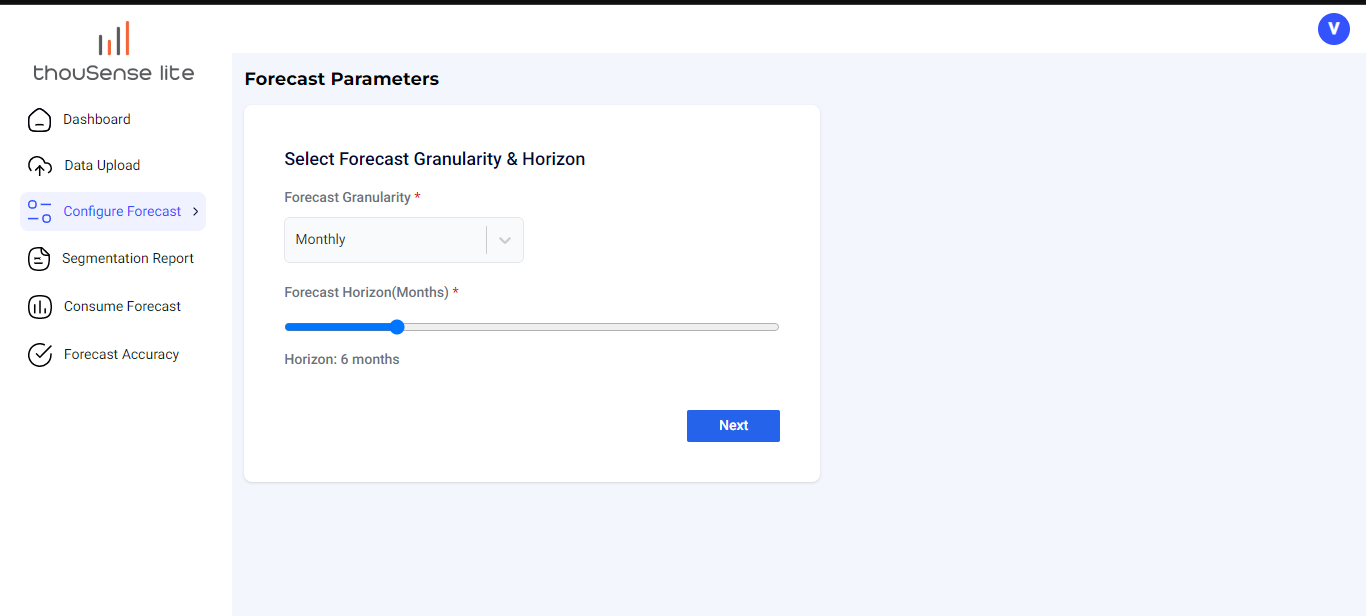
On clicking next, the user will be able to set up their reports
Configure Report
This page allows the user to define the view for the forecast reports. The user can set up as many reports across different cuts basis the demand data and the hierarchy files uploaded by them.
‘Report 1’ is the default report that is picked up from the hierarchy available in the demand/sales file uploaded by the user (all columns to the left of the date in the second last column are considered hierarchy columns).
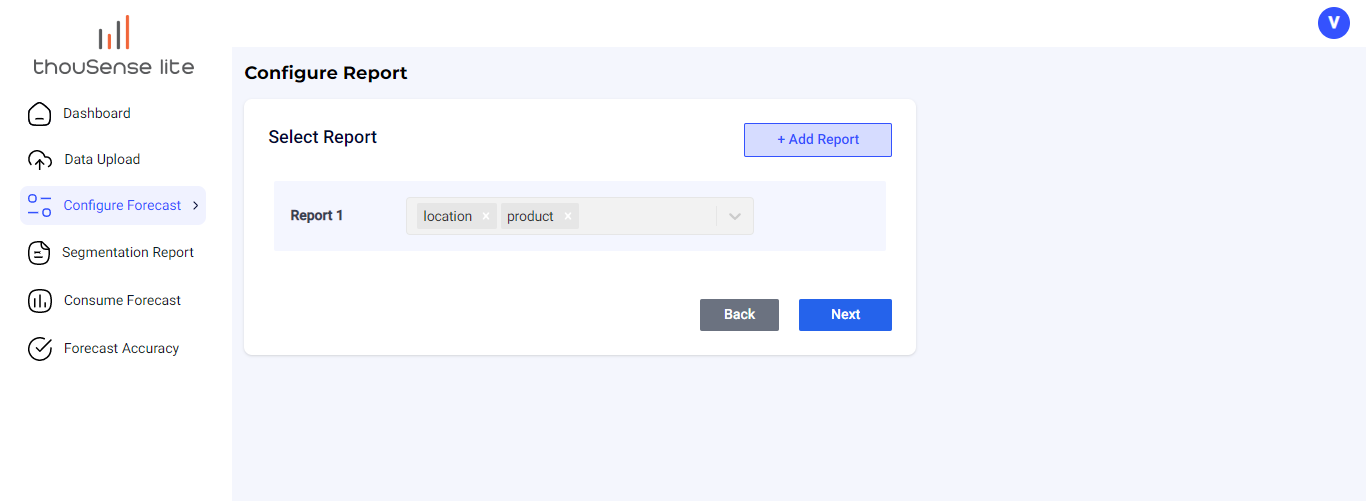
The user can click on ‘Add Report’ to add additional reports on different cuts based on the columns available in the hierarchy files uploaded by the user.
Once the user has added the reports and the cuts at which they want the forecast, they click on 'Next' to define the schedule for the forecast run or for triggering the forecast.
Forecast Schedule
The scheduler allows the user to schedule a forecast in their local time zone at the following levels
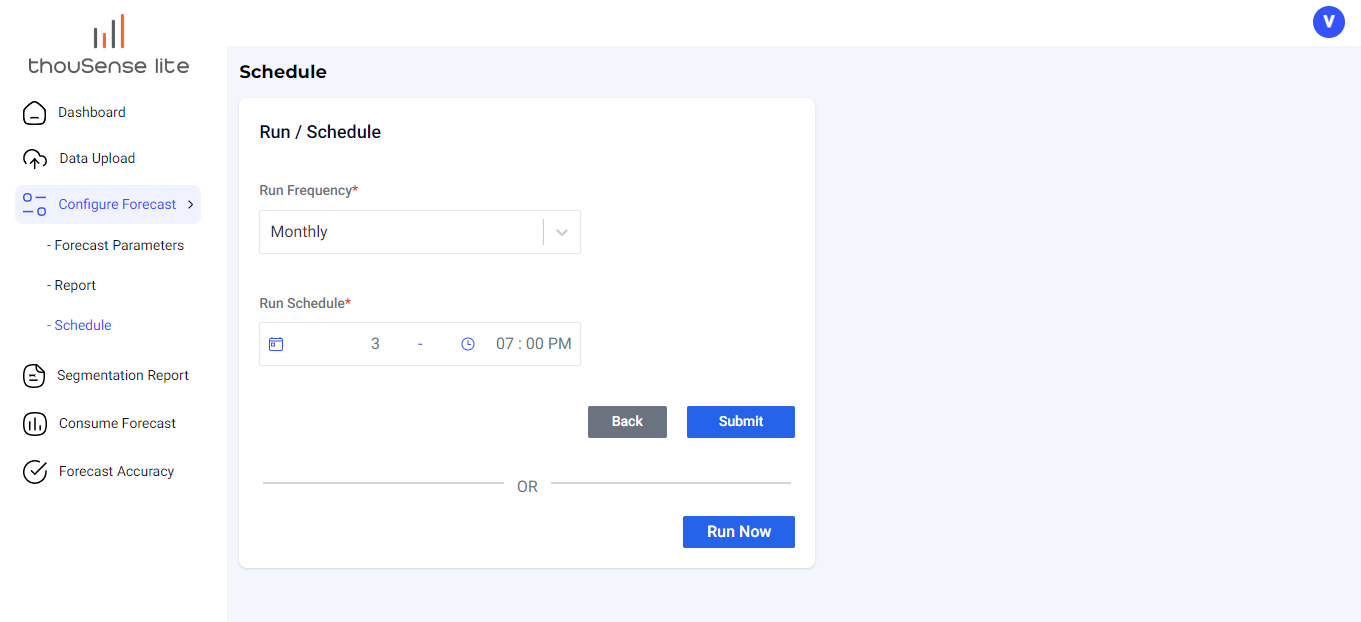
Monthly:
- Select Date– User needs to select the monthly date on which they want to run the forecast
- Select Time - The time at which the user wants to run the forecast
Weekly:
- Select Day of the Week– The day of the week when the forecast will be run every week
- Select Time - The time at which the user wants to run the forecast
Daily:
- Select Time - The time at which the user wants to run the forecast
Note - Monthly forecasts are not allowed for trial users.
Alternatively, the user can click on the 'Run Now' Button to trigger the run instead of scheduling it.
Forecast Run in Progress
When the forecast run is in progress, the user will see an additional widget on the dashboard that gives them information on the status of the run.
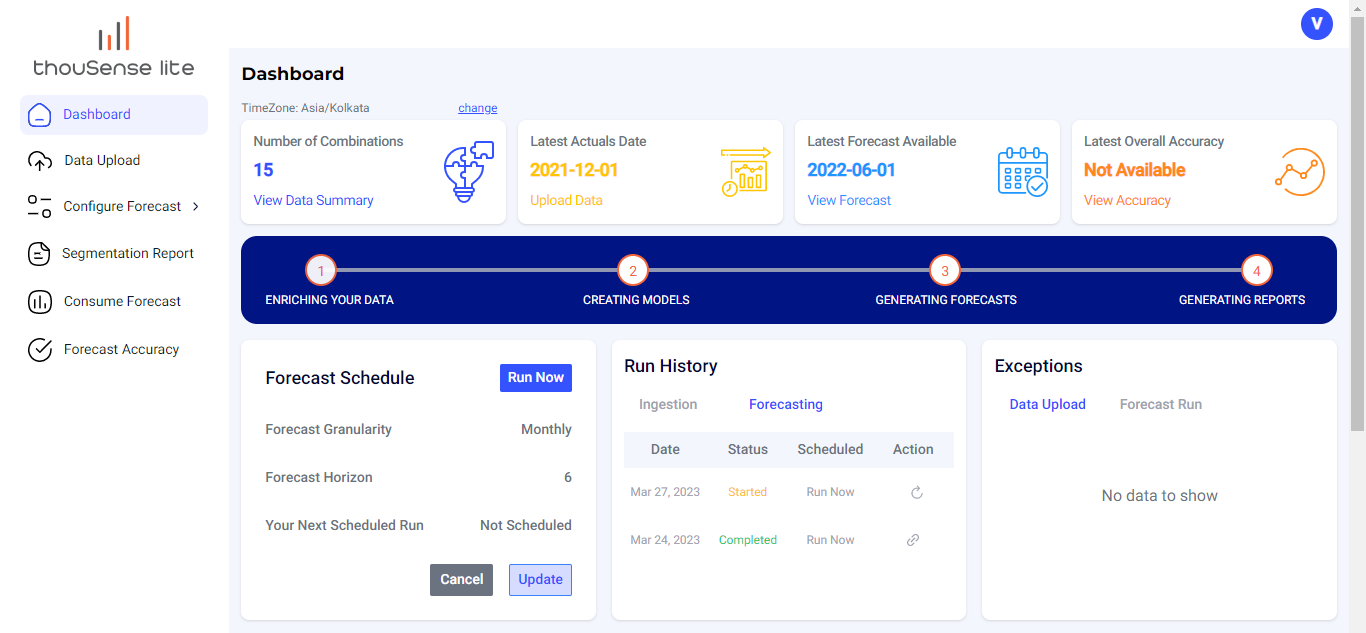
Once all four processes i.e. Enrichment, model creation, Forecast generation, and Report generation are completed, the user will receive an email for the completion of the forecast run. The user can then go to the 'Consume Forecast' tab to start consuming the reports.
Dashboard Widgets
Number of Combinations
The Number of Combinations widget gives the user information on the number of forecastable combinations (basis the hierarchies in the demand file)
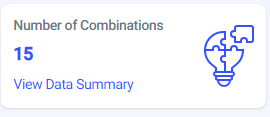
The user can look at the segmentation report to get information relating to the forecastability of a particular combination.
Latest Actuals Date
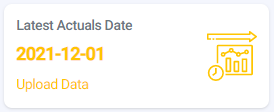
The Latest Actual Date Widget information is derived from the data uploaded by the user. Based on the demand data uploaded, the latest actuals data is the latest date that is available in the demand file for a combination.
Latest Forecast Available
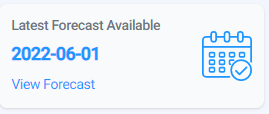
The latest Forecast Available is the date till which the latest forecast has been generated by the user.
Latest Overall Accuracy
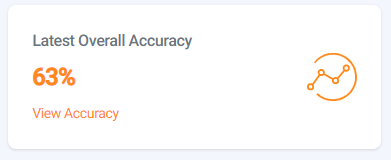
The Latest Overall Accuracy widget gives the user information about the overall accuracy for the forecast run that has been completed and for which any actual data is available.
For Example, if the user uploads data till the month of January and forecasts at a monthly granularity for the next 6 months, the forecasts will be available from February to July. Now, when the user uploads the data of February and triggers a run for the next 6 months, the actuals as well as forecasts for the month of January are now available. thouSense's accuracy calculator will generate the overall accuracy and show the number in this widget
Forecast Schedule
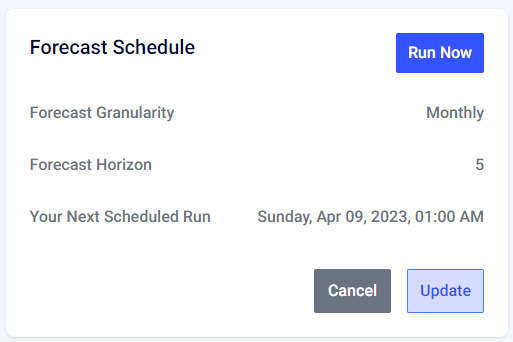
Based on the selection made by the user in the configuration and scheduling screen, the user will see the information on the forecast granularity, horizon, and the scheduled date and time for the next forecast run.
The user can also update the forecast schedule by clicking on the 'Update' button and also directly trigger a run by clicking on the 'Run Now' button.
Note - The Cancel button allows the user to cancel the next scheduled run. To remove the schedule, the user can reset their account or update it by clicking on the update button.
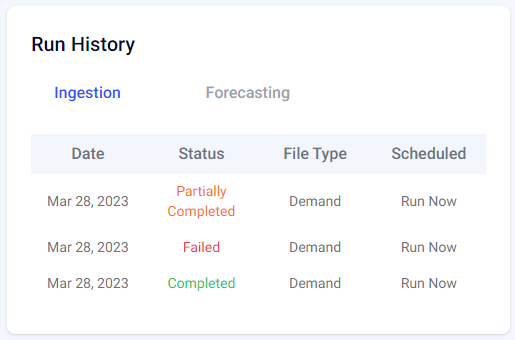
Run History Widget
This widget gives the user information for all the ingestion and the forecast runs that have been triggered by the user along with the information on their status.
Exceptions Widget
The exception widget gives the user details of the issues/errors that have been raised either at the time of ingestion or at the time of forecast.
All the issues that are raised during the ingestion at the setup, and the errors related to all those uploads will appear here. The user can also reach this screen by clicking on the status of ‘Partially Completed’ or ‘Failed’ on the upload summary page.
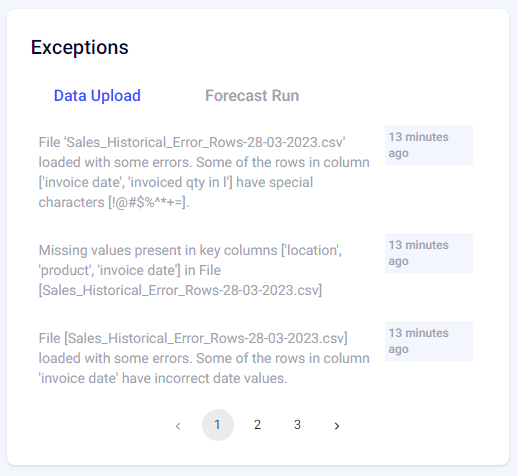
This widget gives the user information regarding the exceptions that may be raised at the time of forecasting as well. These could be related to issues with the completion of the run or merge-related issues that may arise due to a mismatch of data in the hierarchy and demand data files.
The user can use this information to rectify issues in their datasets while also identifying issues in the forecasts if one has appeared.
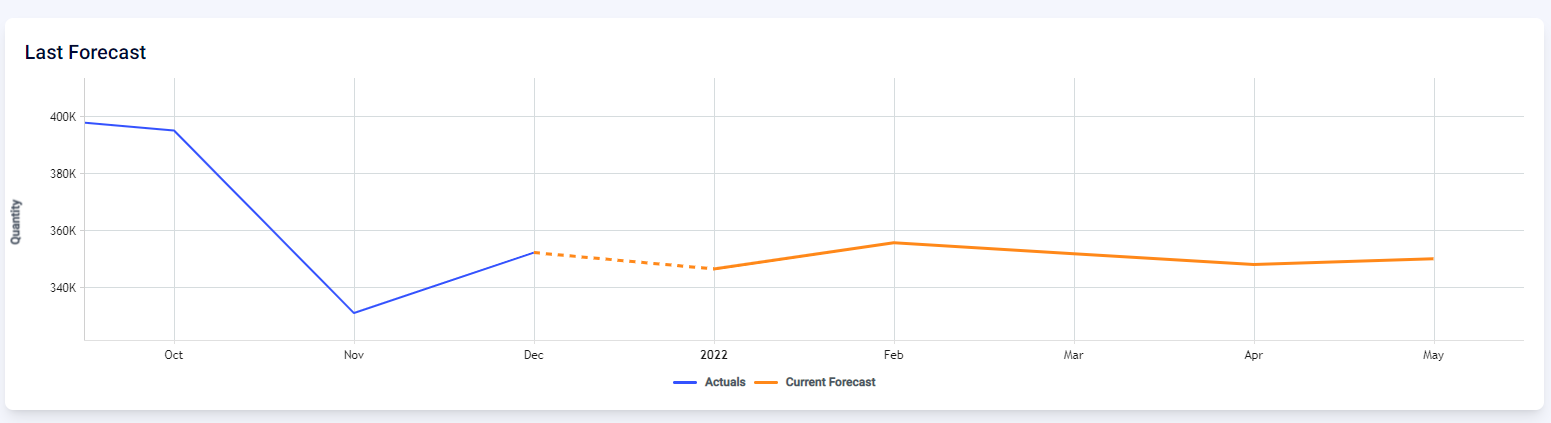
Last Forecast Graph
The last forecast graph widget gives the user a graph of the latest forecast that has been run. The user will be able to view at a glance the overall forecast values at an aggregated level.
Trial User Widget
This widget gives the user information on the number of forecast runs that remain as well as the number of days for the trial that remain.

Consume Forecast Tab
The forecasting tab gives you information about the forecast as well as the accuracy of the historical runs that have been performed.
Forecast Report
The forecasting report tab is where the user can consume the output of the forecast run. The Forecast Report is based on the reports configured at the time of setup.
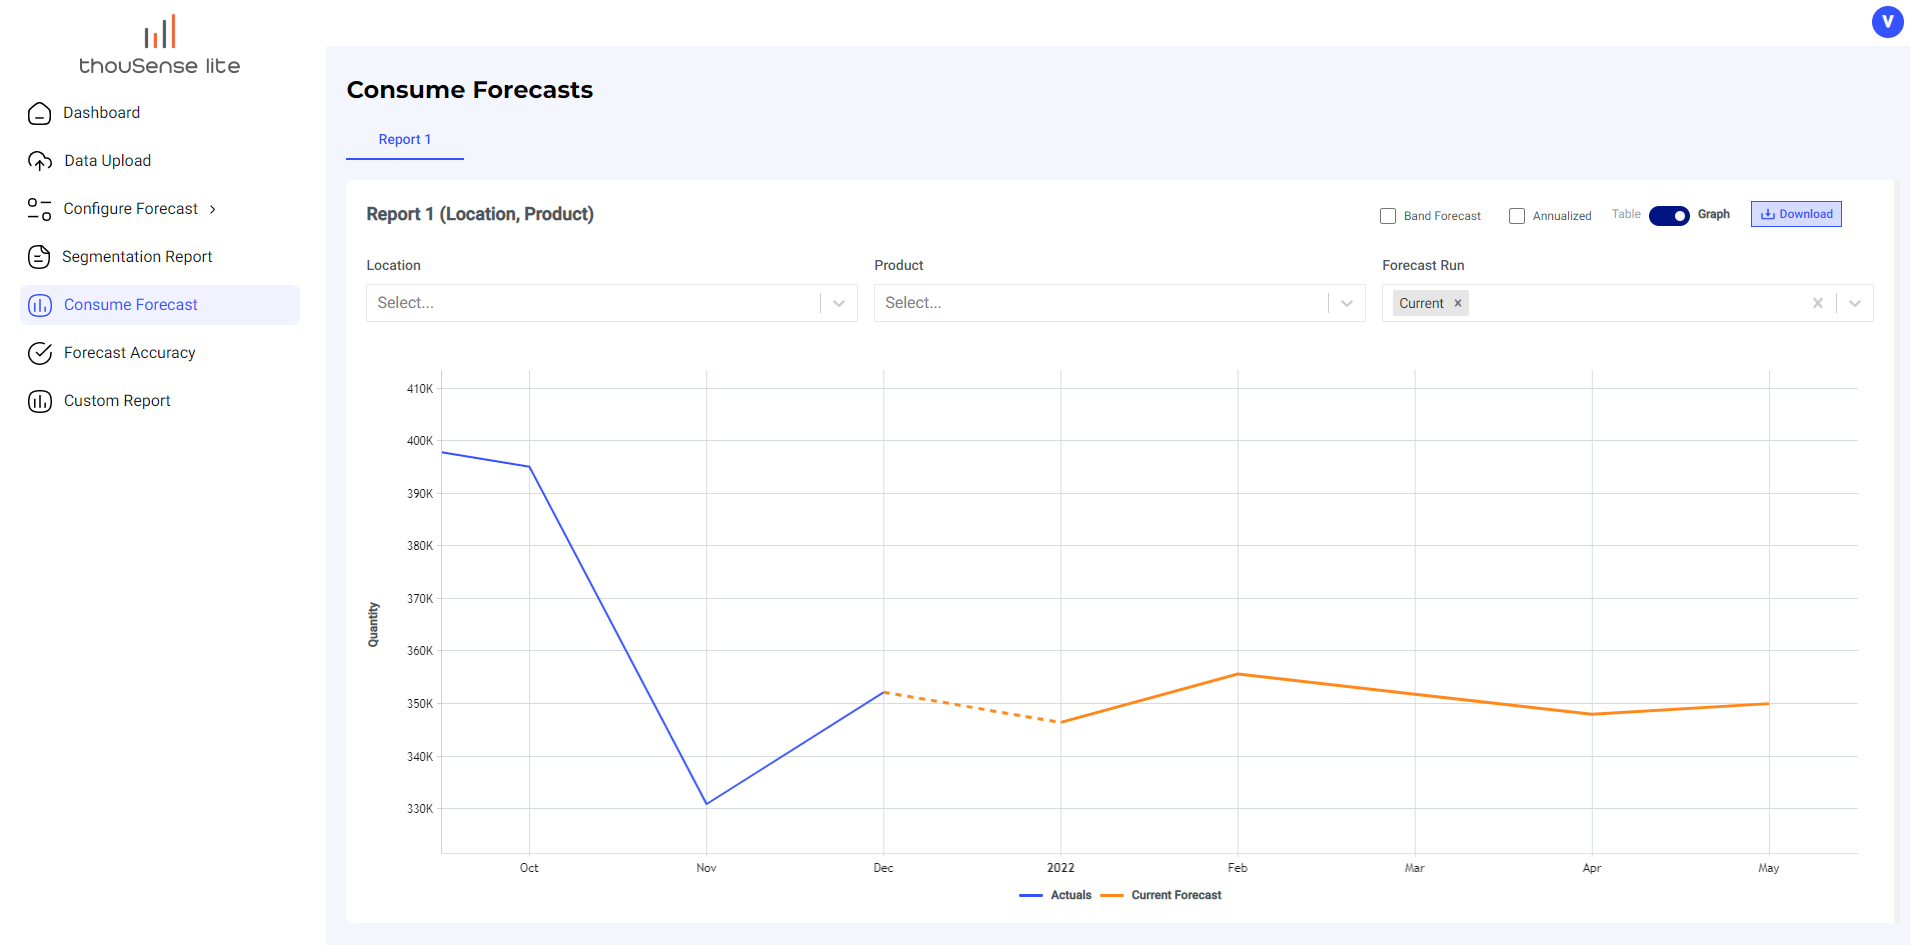
The forecast report will allow the user to filter based on the hierarchy that the user has selected in the report and view the data across historical forecast runs.
The user also has the option to view the forecast in tabular format and download the forecast as a CSV file onto the local system.
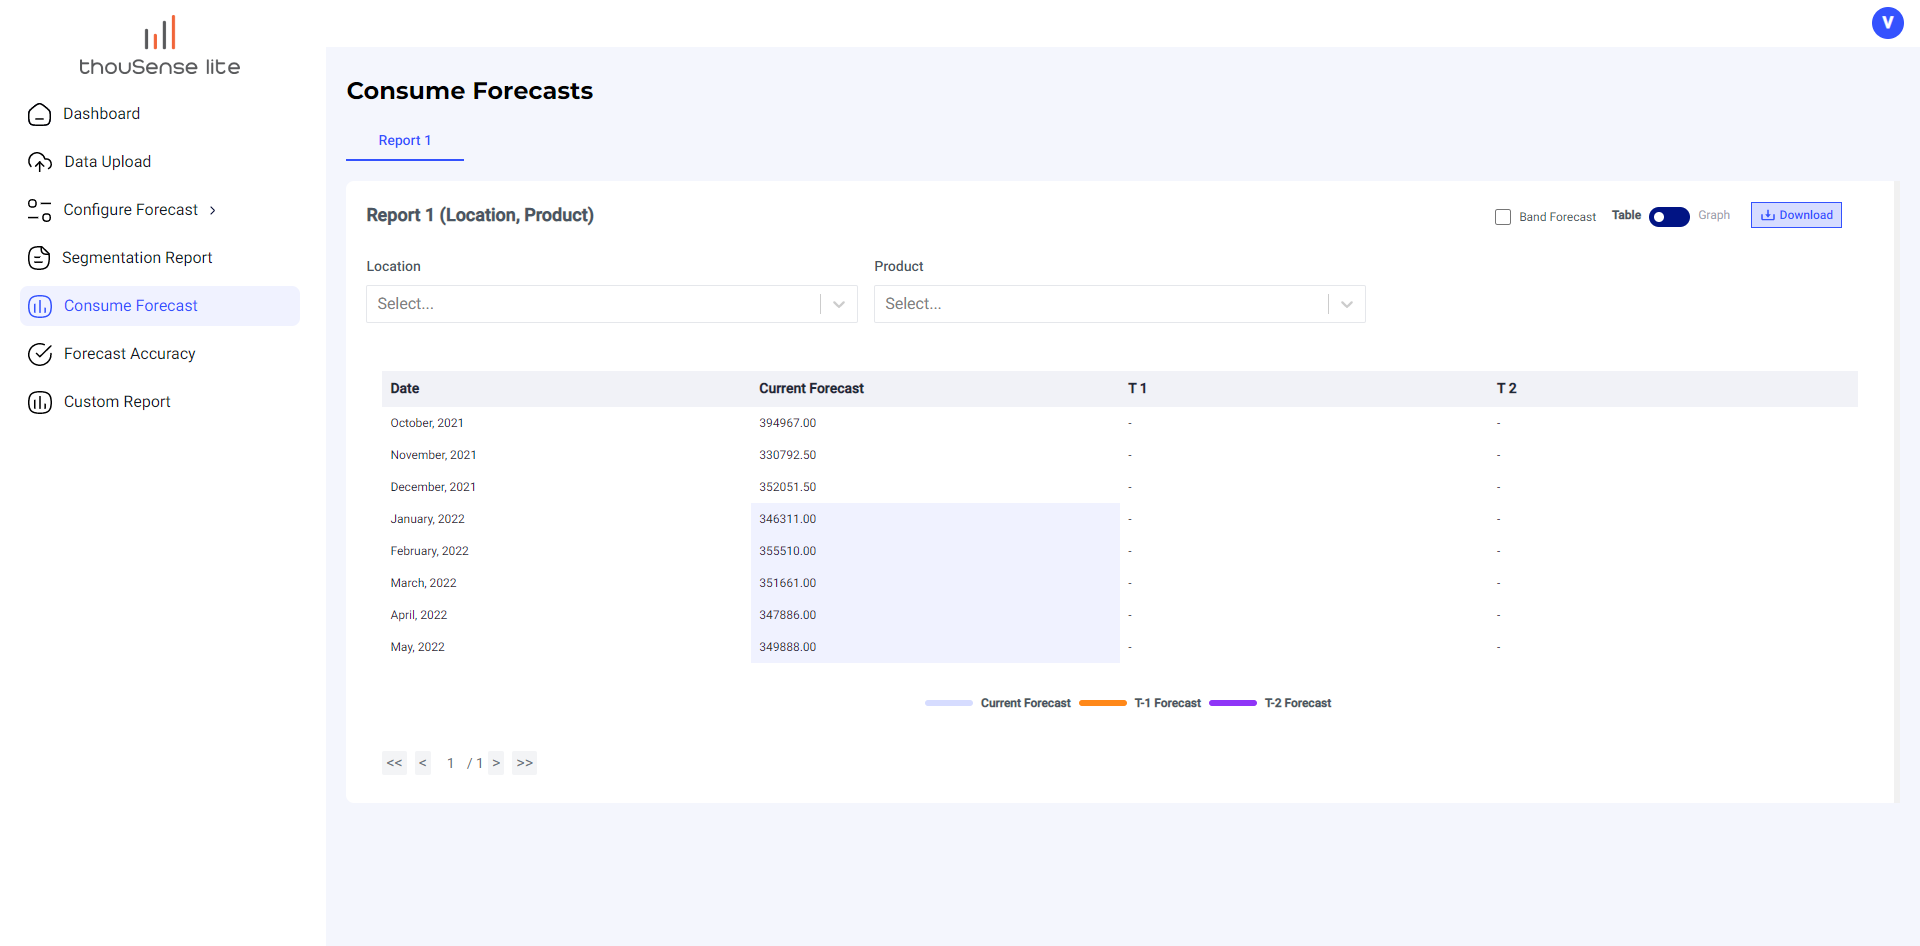
The table view on the forecast report gives you the forecast as a table to consume on the dashboard itself. The user will be able to see the current forecast as well as two previous historical forecasts (T-1 and T-2).
Forecasting – Points to Remember
Calculation of Lags
The lags are created based on the forecast granularity.
Monthly Forecasts
If the forecasting horizon is monthly, all the forecast runs made throughout the entire month will be overwritten and the last run made in the month is the only run that will be saved on the dashboard.
The lag will be created starting on the 1st of the next month.
Weekly Forecasts
If the forecasting horizon is weekly, all the forecast runs made throughout the entire week will be overwritten and the last run made in the week is the only run that will be saved on the dashboard.
The lag will be created starting Monday of the next week.
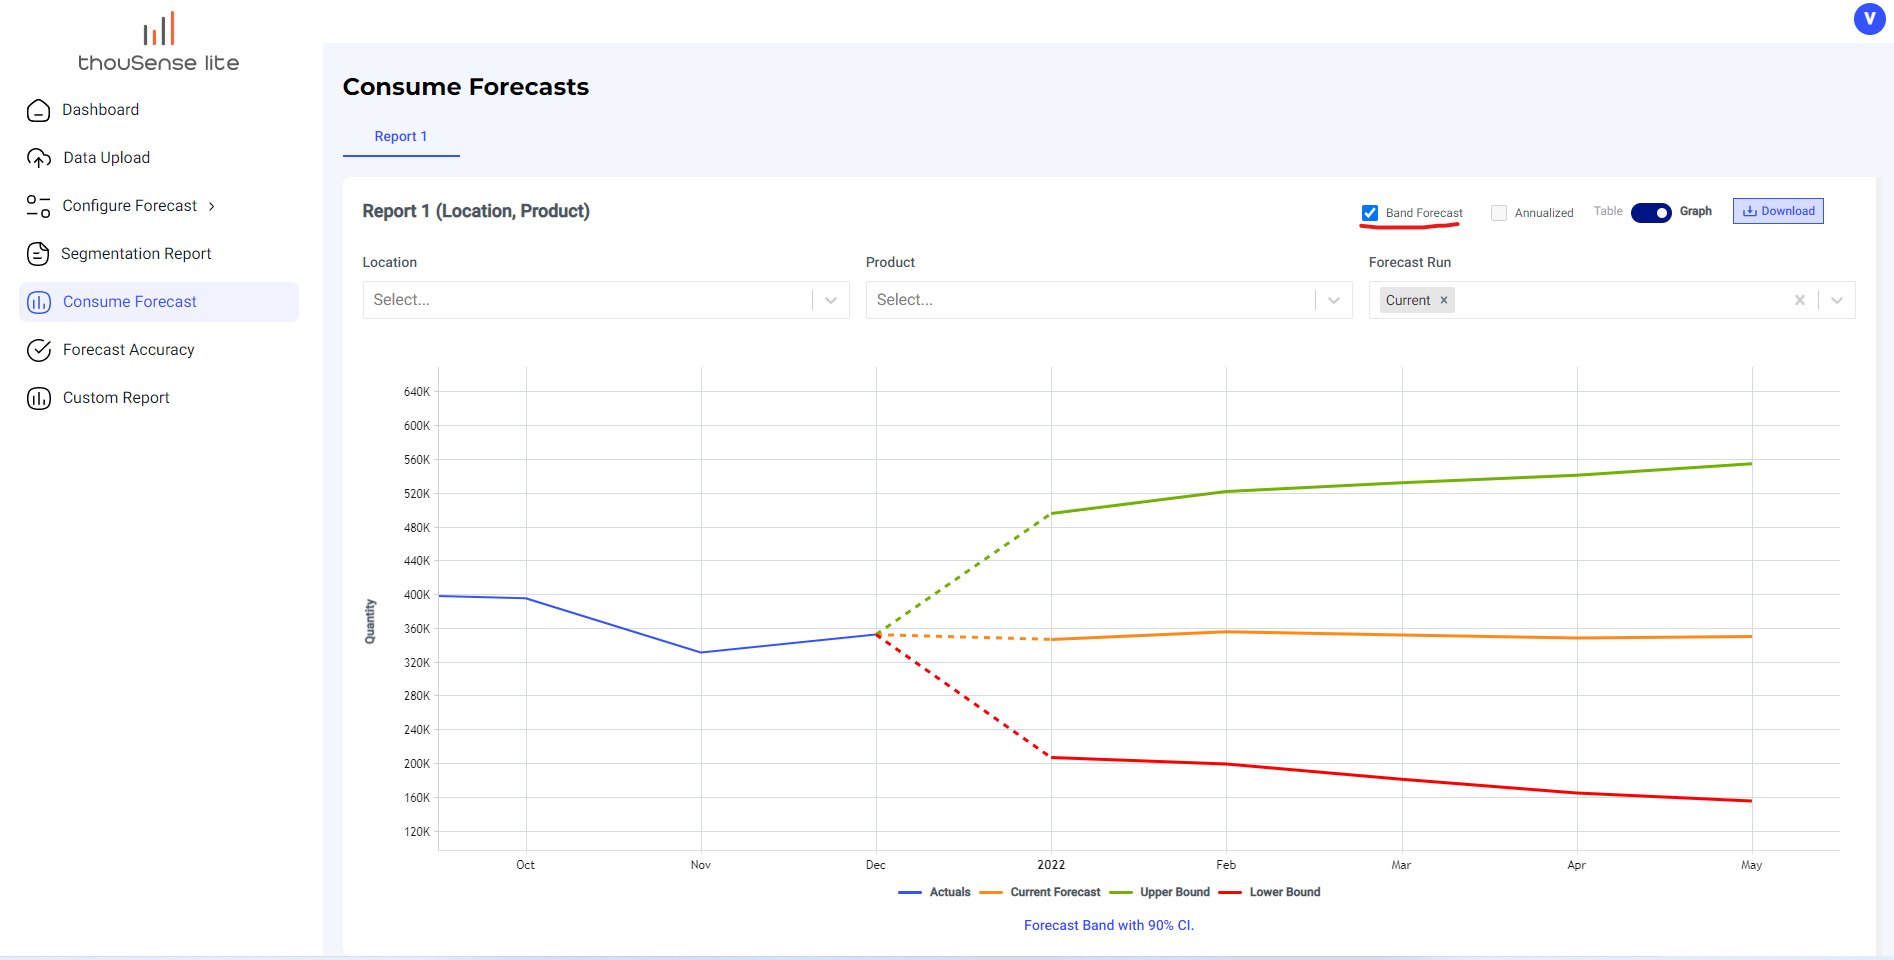
Band Forecast
thouSense also has the capability of generating band forecasts apart from generating point forecasts.
The users, who have subscribed for the feature will see additional bands for the desired confidence interval to aid in the decision-making.
The subscribed users can toggle between the band forecast and point forecast by ticking the checkbox available in the forecast report
Segmentation Report Tab
The segmentation report gives the user a lot of insights into the data that they are uploading to the platform.
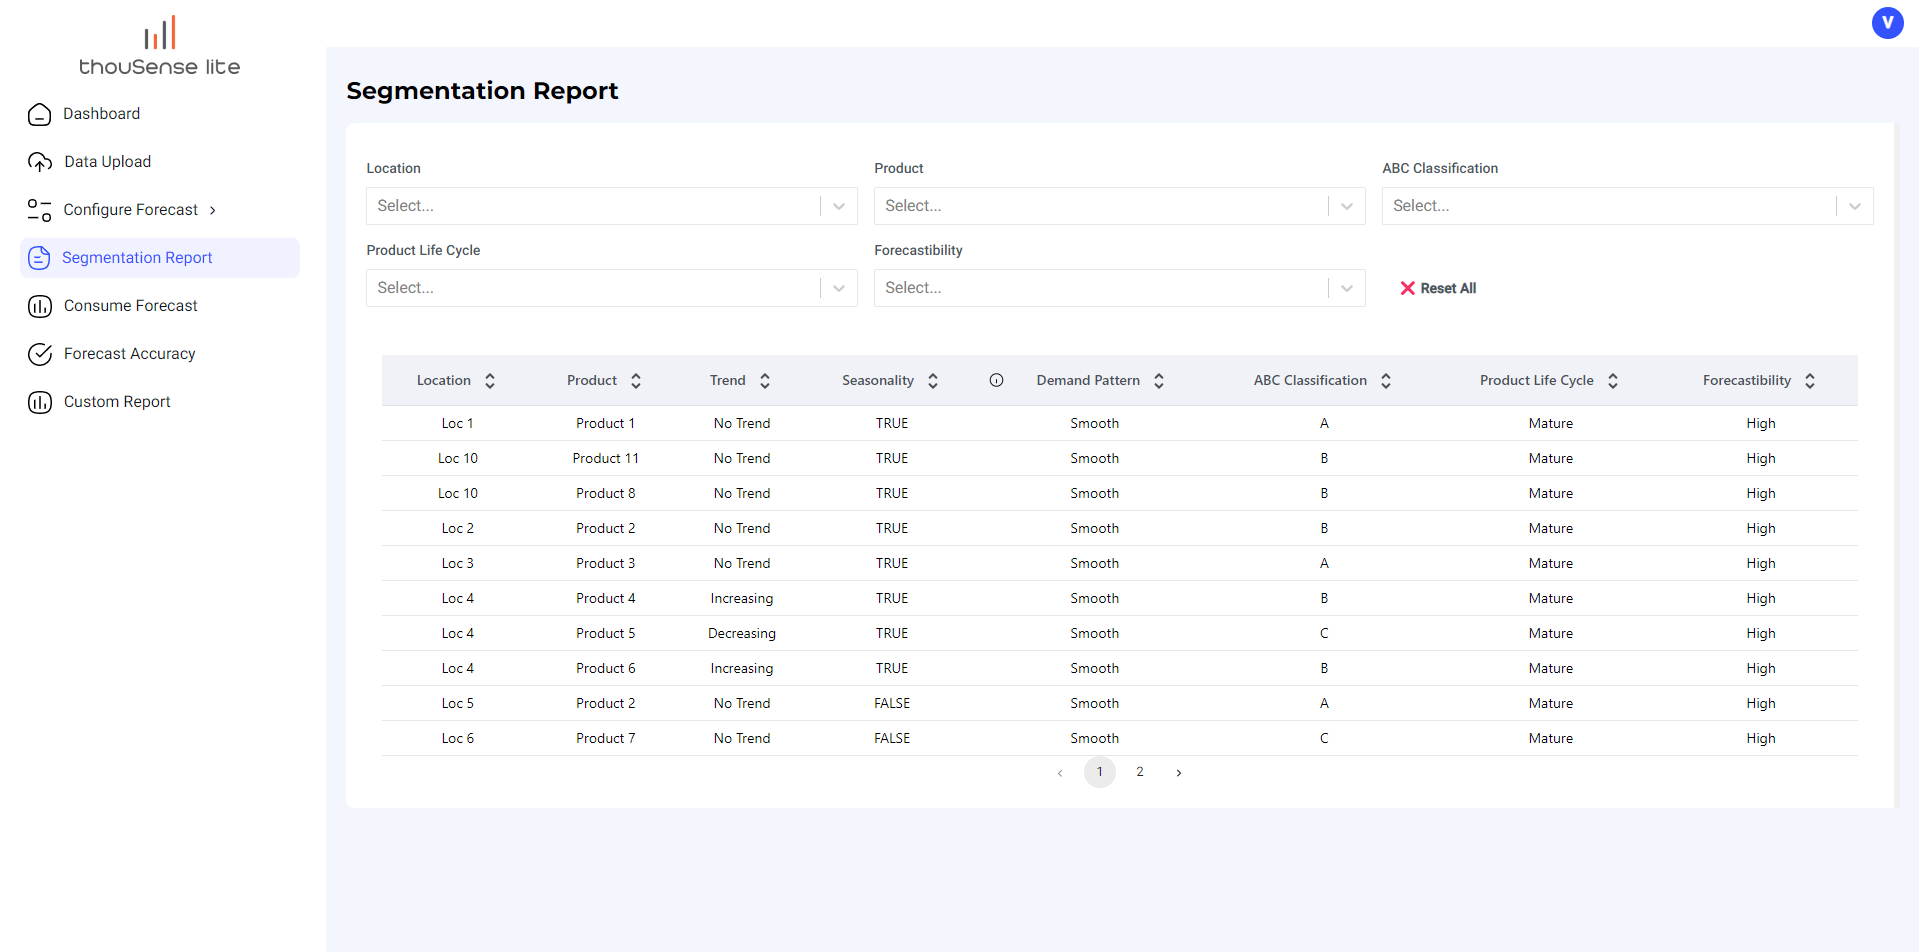
- Trend: The trend component of a time series refers to the general direction in which the data is moving over time. This could be an upward or downward trend, or it could be a relatively flat trend. Identifying the trend can help forecast future values and make informed business decisions.
- Seasonality: Seasonality refers to patterns that repeat themselves in the data over fixed periods of time, such as weekly, monthly, or yearly. For example, sales of Christmas decorations tend to spike every December. Understanding seasonality can help businesses plan for fluctuations in demand and adjust inventory levels accordingly.
- Demand Pattern: The demand pattern component of a time series refers to the shape of the data over time, such as whether the demand is stable, increasing, or decreasing. Understanding the demand pattern can help businesses determine optimal production levels and staffing.
- ABC Classification: ABC classification is a method of categorizing products based on their importance to a business, typically based on their sales volume or revenue. The A category typically includes high-value items that make up a relatively small percentage of total sales, while the C category includes low-value items that make up a relatively large percentage of total sales. Understanding ABC classification can help businesses prioritize their resources and focus on the most important products.
- Product Life Cycle: The product life cycle refers to the stages that a product goes through, from introduction to growth, maturity, and decline. Understanding where a product is in its life cycle can help businesses make informed decisions about marketing, pricing, and inventory levels.
- Forecastability: Forecastability refers to the ease or difficulty of forecasting future values based on historical data. Some time series data may be highly predictable, while others may be highly unpredictable. Understanding the level of forecastability can help businesses determine the appropriate level of inventory and staffing.
Overall, each of these components can provide valuable insights into different aspects of time series data, allowing businesses to make informed decisions and optimize their operations.
Note - The segmentation report becomes available only after the data enrichment leg of a forecast run is completed.
Accuracy Report
The accuracy report gives the user a view of how well the historical forecasts have performed.
The user will be able to view the accuracy reports at the same reporting level that was chosen at the time of the setup.
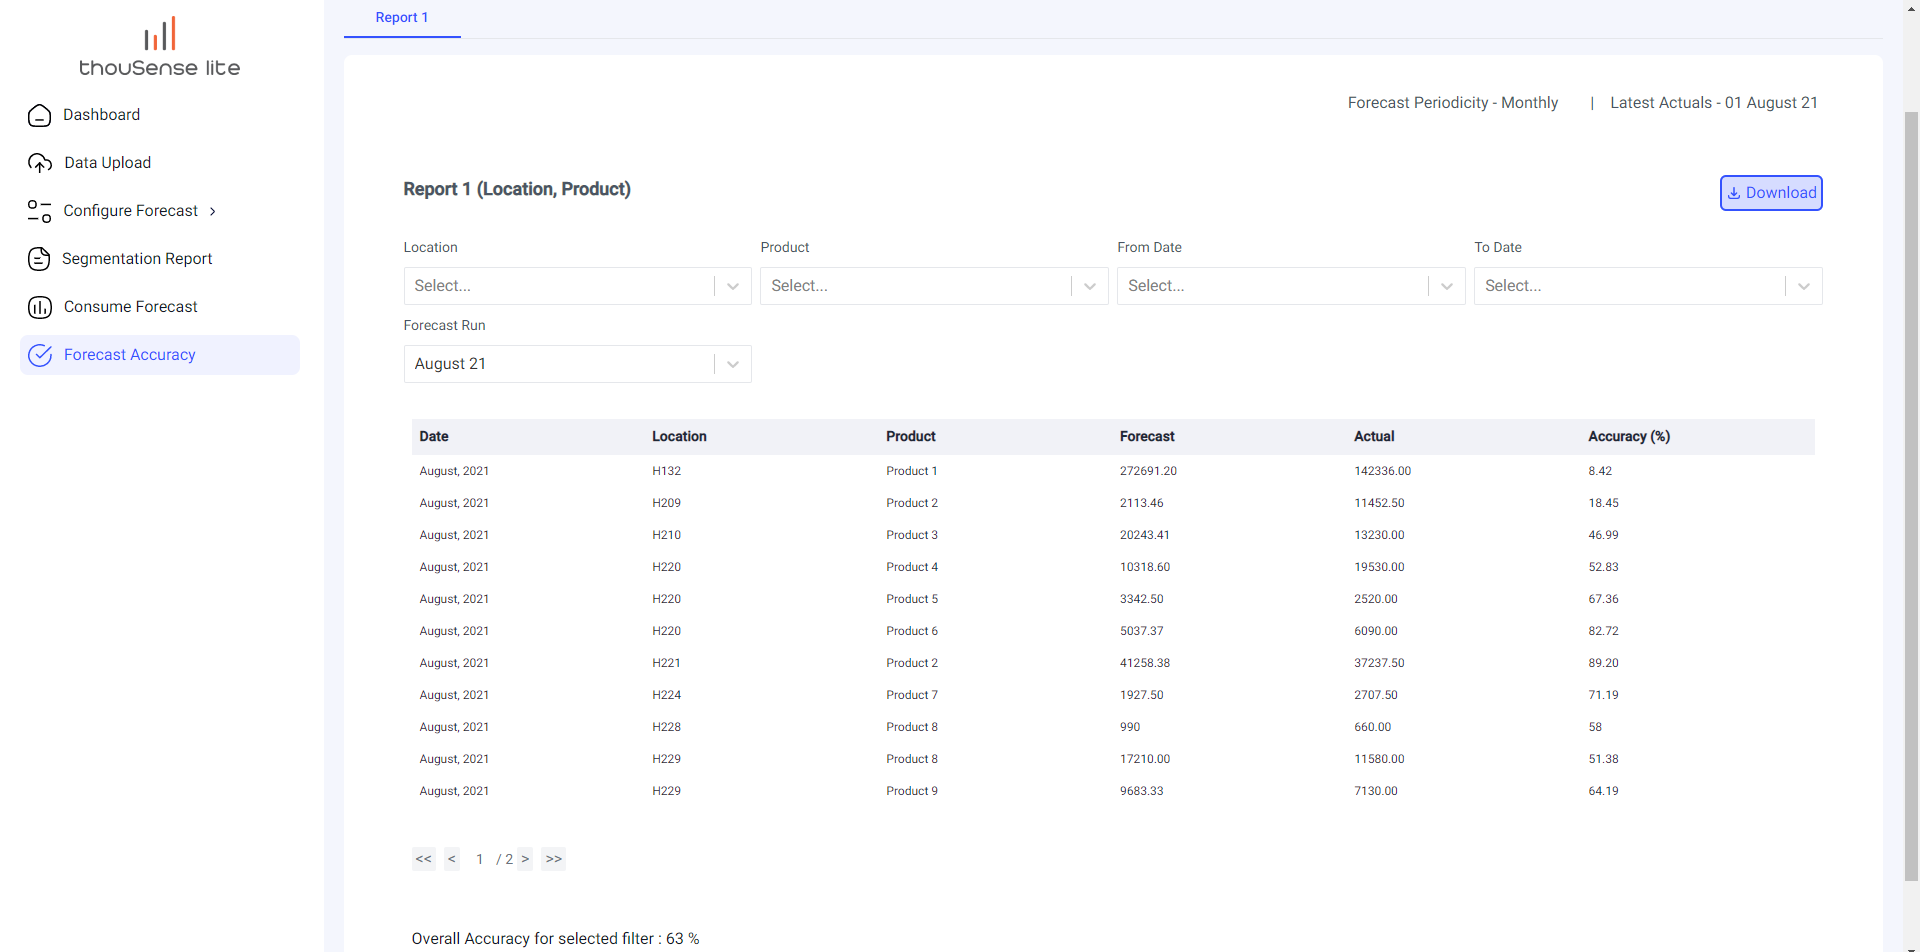
The accuracy is shown basis of the availability of the actuals. If the actuals for any of the forecasts are available, the user will be able to view the accuracy report. If the available actuals (as uploaded in the incremental demand file) are not available, the report will be blank. The user can view the latest actuals available on the accuracy report page.
The user will also be able to download the accuracy report onto their system as a CSV file.
Have a query? Contact Us at support@thouc-labs.ai